As marketers, especially B2B marketers, we care about many metrics. We like followers and audiences, we enjoy people caring and sharing our content, but we really love predicting traffic to our own media properties.
Why? The closer we can measure towards the bottom of the marketing operations funnel, the more likely a metric is to have a relationship with real business outcomes.
Traffic is the first step in the middle of the marketing operations funnel – the first chance to engage an audience member on your home turf, away from the distractions of social networks and ad-laden media sites.
So, when BuzzSumo approached us with 50,000 articles of B2B-focused content and social sharing data, we thought that was an interesting source of data to mine and analyze. What if we could look at more than just social sharing? What if we could look at some SEO data and ultimately some click traffic?
What we found surprised us and surprised BuzzSumo. Let’s take a brief walk through the B2B content landscape.
Preparing the Data
What BuzzSumo originally shared with us was a handful of metrics – social shares, linking domains, their Evergreen score (a measure of shares that occur 30+ days after the article is published), the article titles, authors, and URLs. In data science and AI work, the first step in the process of determining what’s important is to prepare the data.
The first step in preparation is exploratory data analysis. What’s in the data? What does it look like? We annotated the data and cleaned up things like broken URLs to make the data that we received ready for further use, as well as reduced all text to lowercase and removed anomalous punctuation.
The second step in preparation is appending the data. In this case, we didn’t get any traffic information. With our data partner Bit.ly, we appended bit.ly’s click tracking for each of the 50,000+ URLs to get the number of times those URLs were clicked on. Now, bit.ly tracking is not comprehensive. It’s not measuring every click on an article. What it does measure, however, is comparative importance and directionality. An article that’s received 50 clicks is more trafficked than an article that receives 5, and bit.ly’s data makes for great apples-to-apples comparisons of an article’s ability to pull readers in to actually read the text.
Using proprietary, custom-built software, we also extracted all the article text for each article, giving us not only what the headline was, but also what the article was about.
Engineering the Data
The third step in the process before using AI and machine learning is feature engineering. This is a fancy way of adding new variables to the data based on existing variables.
Some of the features we engineered included:
- Key topics such as marketing, finance, healthcare, etc. based on tagged keywords and phrases in the article headline and text
- Language information like readability scores, grade level of the article, etc.
- The domain of the publication based on its URL
Feature engineering helps us build out what could be additional clues or contributing information about what makes an article popular and well-read.
Limitations
No data exploration of B2B content can be discussed without acknowledging the elephant in the room: no one has credible sharing data from LinkedIn. Anyone who says they do are violating LinkedIn’s Terms of Service. Why? LinkedIn restricted its data to the public and to marketers. Until early 2018, publishers could obtain information from LinkedIn about how many times an article was shared, but they shut down that API and thus we have no way of knowing the number of shares of articles.
Building the Machine Learning Model
Using machine learning, we then took the gigantic database – essentially a really, really large spreadsheet – and with the R programming language and the H2O machine learning engine, built a predictive model of what is likely to predict the number of clicks on any given article. The process of building a model typically means choosing one or more different algorithms and then running those algorithms against the data. The best model is the one that has the lowest rates of error. In total, we tested 70 different model types before settling on the winning model.
So, What Predicts Clicks?

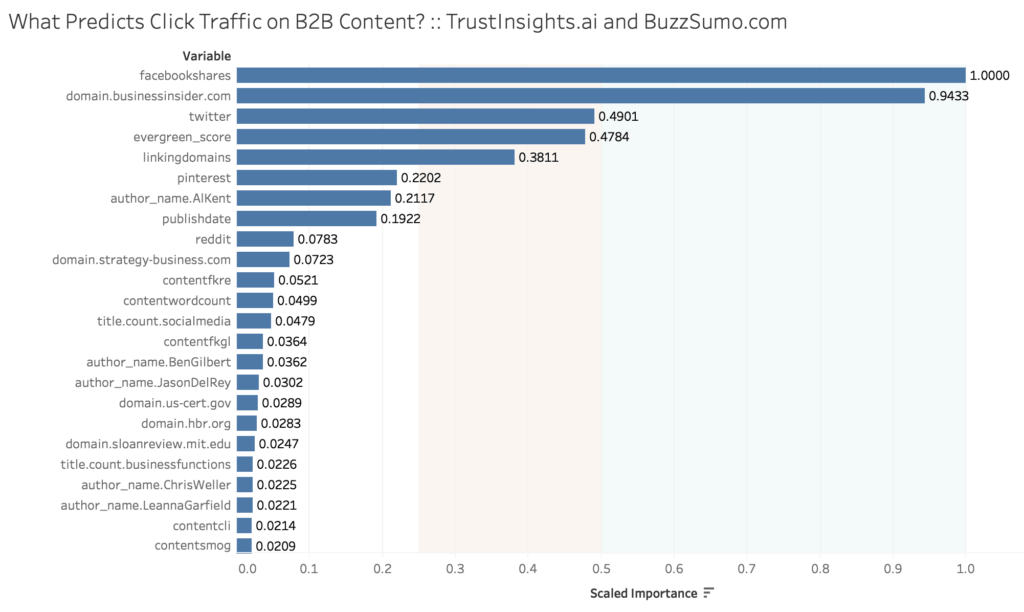
Figure 1: Blue bars in the green-shaded area are the strongest predictors of clickthrough traffic. Blue bars in the orange shaded area are moderate predictors of clickthrough traffic. Blue bars in the unshaded area are weak or non-relevant predictors of clickthrough traffic.
In our final model, the following criteria predict traffic:
- Facebook Shares: the number of times an article is shared on Facebook is the strongest predictor of the amount of clicks and article will receive.
- Domain.businessinsider.com: articles which appear on Business Insider are strongly predicted to attract a lot of clicks.
- Twitter Shares: as with Facebook, the number of times an article is shared on Twitter is a moderate predictor of clicks.
- Evergreen Score: BuzzSumo’s internal calculation is also a moderate predictor of clicks.
- Linking Domains: the number of linking domains to an article is the final moderate predictor of clicks.
So What?
What does this mean? How do you use this information?
Any time you’re working with a predictive model like this, a type of driver analysis, what the model is essentially saying is that the features with the strongest importance – such as domain, Facebook Shares, etc. – have a statistically strong relationship with the desired outcome – more clicks. Once you know what features are important, the next step for any B2B marketer is to establish a testing plan.
Following the scientific method, ask a question – does Business Insider really drive traffic well? – and then start the process of formal hypothesis testing. If you publish an article with a Business Insider journalist/author, and you publish the same article on, say, your blog – then your hypothesis would be that more people are likely to read the Business Insider version than the version on your blog, given equal amounts of promotion and social sharing.
What Not To Do
Equally important in any kind of examination like this is what not to do. The cardinal sin of generalization applies most; generalizing that a data point like Facebook Shares matters most and that’s all you should measure your content marketing on from now on is NOT what this research proves.
Nor can we generalize this data to all forms of content marketing; this is specific to articles that come from BuzzSumo’s list of B2B-specific domains.
None of this information should be treated as immutable truth. Hypothesize, test, and find answers for your own data.
What Next?
Based on these findings, look at your own data, especially if you’re publishing content in collaboration with authors and journalists. Look at the content that has done well for you and see if your best content can be upgraded and published on B2B domains like Business Insider. If you’re a BuzzSumo customer, use the Evergreen score as a predictor of whether an article will get clicks or not, and then test your hypothesis rigorously.
We hope you’ve enjoyed this exploration of predicting traffic and B2B content and it gives you some starting points for testing your own data, content, and ideas.
|
Need help with your marketing AI and analytics? |
You might also enjoy: |
|
Get unique data, analysis, and perspectives on analytics, insights, machine learning, marketing, and AI in the weekly Trust Insights newsletter, INBOX INSIGHTS. Subscribe now for free; new issues every Wednesday! |
Want to learn more about data, analytics, and insights? Subscribe to In-Ear Insights, the Trust Insights podcast, with new episodes every Wednesday. |


