INBOX INSIGHTS: Consistency, Data-Driven Content Curation, Quitting Facebook (10/6) :: View in browser
Consistency is Key to Good Data Health
Last week I restarted my strength training. You know what? It sucks to start over.
You know that saying, “it’s just like riding a bicycle”? What they don’t tell you is how frustrating it can be. If you took a few years off from riding a bike, or in this case, lifting weights, you can’t pick up where you left off. You need to rebuild your strength through new habits. Your muscles will be sore. Sitting down and climbing stairs will be challenging. You may even want to give up.
Why am I telling you this? Because this is a preventable problem. I could have prevented this from happening. I didn’t need to start over if I hadn’t stopped in the first place.
Ok, so let’s get to the point and why this is relevant to you. Consistency is key. Consistency with your data collection. Consistency with your data analysis. Consistency with your data-driven decision. Consistency with your data health.
I work with a lot of clients that may look at their data once every few months. It might not be their area of expertise or it might not be a big priority for them. It might not be presented in a way that is accessible or understandable. Data is an easy thing to ignore. You can make decisions without data. You can run a business without looking at historical data. Those are not great options, but they are realities if you choose them. If I only picked up my weights once every few months I would be forever starting over from the beginning, not making any progress.
So what’s the solution? Much like taking care of your health, you need to create a routine and stick with it. Start small and build up to bigger things.
In the context of your data health, start small. Make sure it’s set up correctly and make a plan to review your data once a day. You don’t need to look at all your data, you can start with one metric. Aim for five minutes a day or less.
How do you pick a metric? Walkthrough a simple KPI map. A KPI mapping exercise will help you prioritize your data to understand what is important.
Let’s say for example I run an eCommerce website where I sell widgets.
My business goal is revenue. Therefore, my KPI will be sales from my site. A metric that I’ll look at to track my KPI is site visits. Without site visits, people won’t buy anything, and I won’t have any revenue.
So once I have my website analytics set up, I can look at my site traffic every day. Does it go up? Does it go down? Is there a trend or seasonality? An easy to pull these stats is to connect your web traffic to an automated dashboard. Google Analytics connects natively to Google Data Studio. You can set up a simple table that shows you the daily traffic.
Once you have a couple of weeks’ worth of data that you’re reviewing daily, start adding in other metrics. These metrics should be ones that tell you whether you’re on track to meet your goals. are you collecting data about visits to specific product pages? What about cart fills? Those are great metrics that will help you to understand if you’re on track.
Again, the key is consistency. Just like working out, start small. If you try to do everything all at once, your chances of success start to go down as you relearn along the way. Data health, in the sense of forming a new habit, is the same as your own personal health. Do a little every day and build on that success.
How do you stay on top of your data health? Let me know in our free Slack group, Analytics for Marketers!
– Katie Robbert, CEO

Do you have a colleague or friend who needs this newsletter? Send them this link to help them get their own copy:
https://www.trustinsights.ai/newsletter

In this episode, Katie and Chris reflect on the revelations about Facebook Inc. and how a company’s business practices can put it so far out of alignment with your core values that you have to stop doing business with them if you want to stay true to your values. But making a major change like ceasing to do business with Facebook isn’t something you can just flip a switch on: you need a roadmap, a plan of action, and steps to take to determine how to reduce your dependence on Facebook’s platform. Tune in to find out more!
Watch/listen to this episode of In-Ear Insights here »
Last week on So What? The Marketing Analytics and Insights Live Show, we looked at SEO keyword analysis basics – how to get started picking apart a list of keywords for prioritization.
Watch/listen to this episode of So What? here »
This Thursday at 1 PM Eastern, we’re going to take a look at performing basic SEO competitive keyword analysis.
Are you following our YouTube channel? If not, click/tap here to follow us!
Need a reminder?

Here’s some of our content from recent days that you might have missed. If you read something and enjoy it, please share it with a friend or colleague!
- INBOX INSIGHTS, September 29, 2021: Project Failures, Content Marketing World, Content Roadmaps
- {PODCAST} In-Ear Insights: Using Data to Build a Content Marketing Roadmap
- The Secret to Producing Content At Scale

Get skilled up with an assortment of our free, on-demand classes.
- Predictive Analytics and Customer Experience
- How to Deliver Reports and Prove the ROI of your Agency
- Proving Social Media ROI
- What Works on Instagram: A Data-Driven Study
- Next-Level Twitter Analytics
- Powering Up Your LinkedIn Profile (For Job Hunters)
- Competitive Social Media Analytics Strategy

In this week’s Data Diaries, let’s solve a content marketing problem. One of the challenges of content marketing is discoverability – the ability for people to discover our content. Certainly, search engines help to solve this problem, but they do so imperfectly. What’s more, if we solely rely on search engines, then we risk sending our key audience to our competitors – not ideal. Social media postings and email marketing are great for drawing attention to specific pieces of content, but aren’t a comprehensive, simple way to help people discover stuff.
What’s the solution? Curation. Not just “let’s copy a bunch of links to our Twitter account”, but real, intentional curation. Here’s an example. How many videos do we have on our YouTube channel? 205. How many of those have you watched? Probably less than a dozen. Likely less than a handful. Why? Because there’s no easy way for you to discover them.
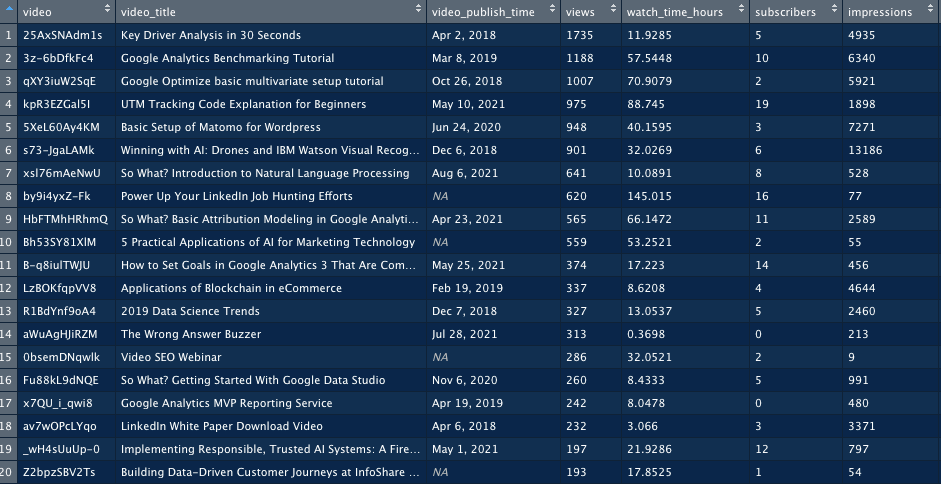
Frankly, we have no idea what we’ve published on there, either, with all the livestreams, keynotes, etc. So how would we start the process of curating these videos? Start by exporting all of them from YouTube Analytics:

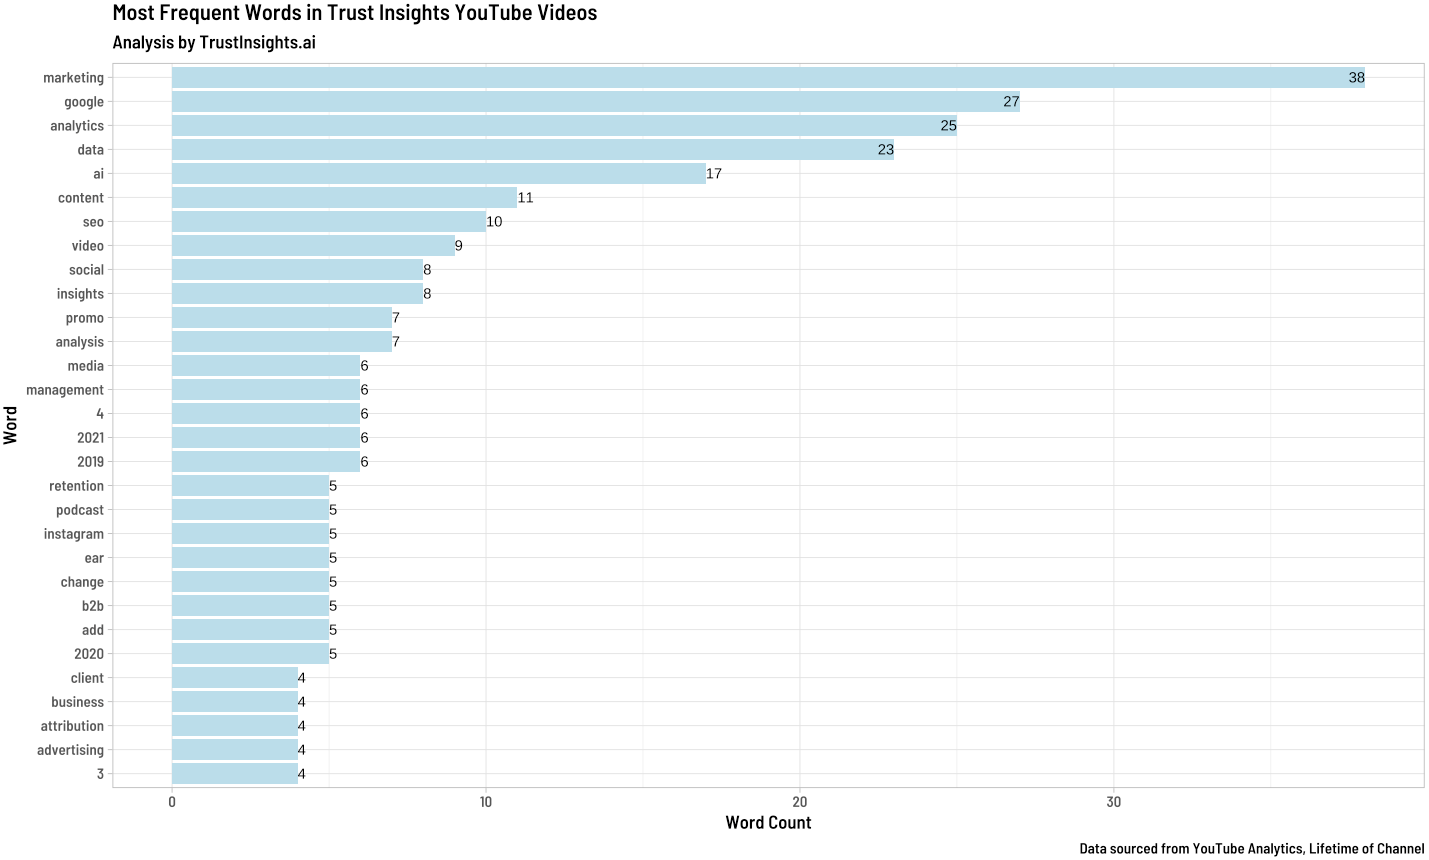
Next, we look at basic word counts. How much does any particular word make it into our video titles, once we remove our brand name and show titles (such as So What? and In-Ear Insights):

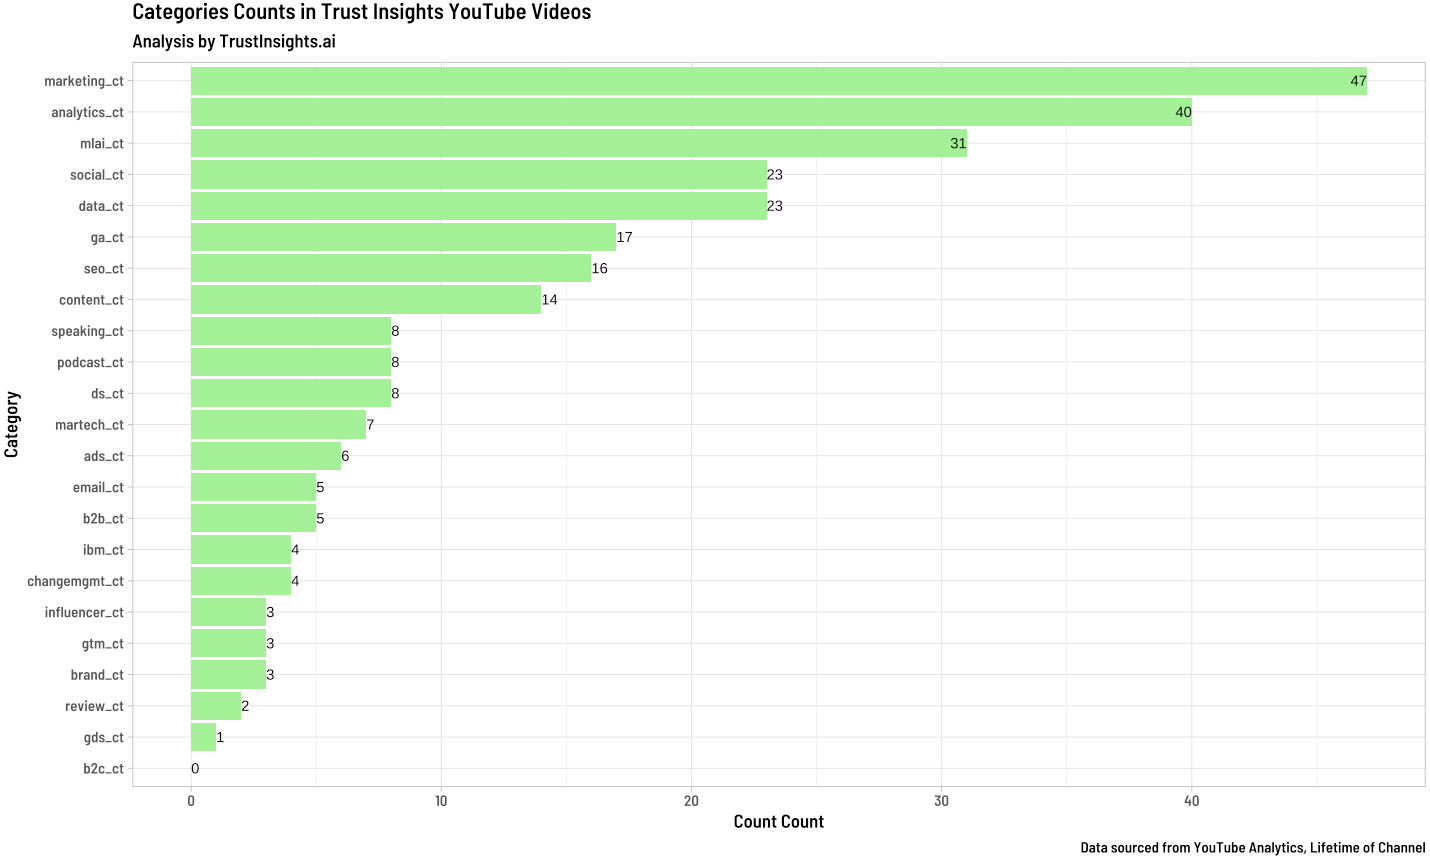
Already, we see a clear theme, obviously parseable topics and themes. We’ll build some categories like social media, content marketing, etc. to see how many videos fit in each of these categories:

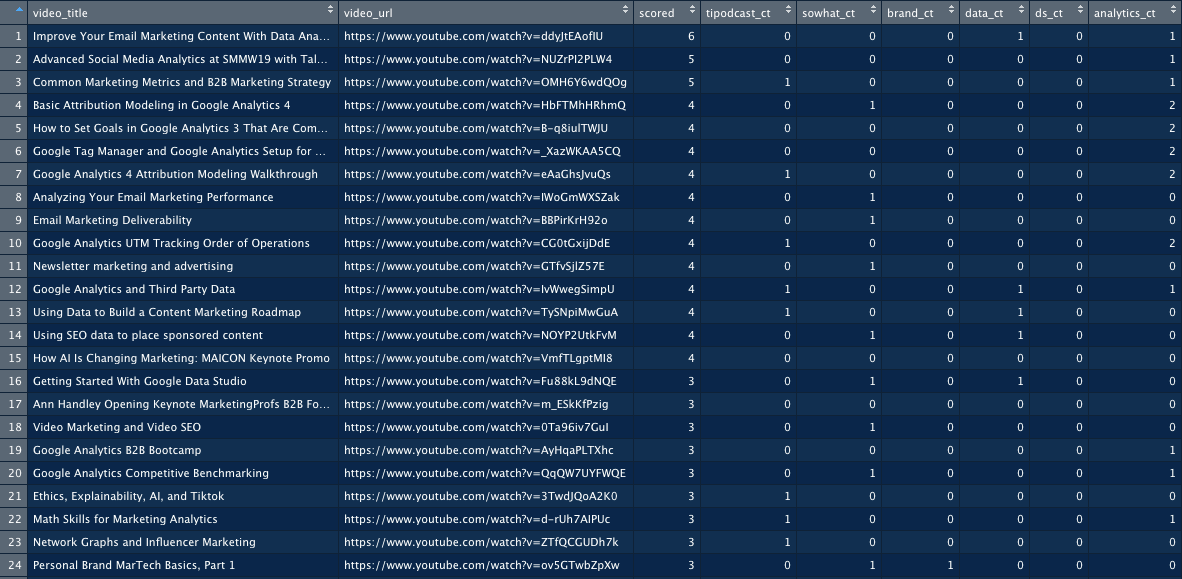
With each category, we can now export specific videos to make things like YouTube playlists, or better, filtered content that can go in things like newsletters, blog posts, social content, and more. Let’s take a look at our summarized breakdown:

Suppose we wanted to just share a list of videos about SEO? Now, with this data tabulated, we can do exactly that, helping our audience find videos on that specific topic:
- Core Web Vitals and 2021 SEO Planning
- Google MUM, SEO, and Content Strategy
- Introduction to Google Search Console
- Optimizing Pages for SEO
- SEO Analytics
- SEO and Customer Retention
- SEO keyword analysis basics
- SEO Keyword Identification Processes
- Solutions in search of problems
- Understanding YouTube’s Algorithm and Video SEO
- Using SEO data to place sponsored content
- Video Marketing and Video SEO
This is data-driven content curation, and it’s one of the best ways to help your audience find the content you’ve worked so hard to produce. It’s even more important now when AI-based content recommendations may not surface what you want your audience to find in search and social media. That’s what we’ll be doing with our YouTube content in the future.
This technique applies to any content where you have access to the content name, like email newsletters, blog posts, and more. Try it with your own content and curate better experiences for your audience!

This is a roundup of the best content you and others have written and shared in the last week.
SEO, Google, and Paid Media
- SEO Channel Context: An Analysis of Growth Opportunities via Good To SEO
- The Comforting Mirage of SEO A/B Testing
- 12 Completely Outdated SEO Practices You Should Avoid
Social Media Marketing
- Report: Social media audience trends during the pandemic via Talkwalker
- The Sleeping Ad Giant That Is TikTok via Social Media Marketing via E-Commerce Times
- Clubhouse Adds Universal Search, Room Replays and Clipping Functionality to Help Boost Sharing via Social Media Today
Content Marketing
- Learn how to improve your content with Search Console Insights
- Content Marketing Metrics to Measure Results via MarketingProfs
- 12 Qualities of Great Content Marketers
Data Science and AI
- Call for Code app uses AI to make homes safer and more resilient IBM Developer
- 5 Key Insights on AI That Will Change How You Do Marketing
- What Content Marketing Analytics Really Measures

Are you a member of our free Slack group, Analytics for Marketers? Join 1900+ like-minded marketers who care about data and measuring their success. Membership is free – join today. Members also receive sneak peeks of upcoming data, credible third-party studies we find and like, and much more. Join today!

- Are you happy with the answers you’re getting out of Google Analytics today?
- Are you confident in the decisions you’re making from Google Analytics?
- Are you secure in the knowledge that you’re set up properly to benefit from Google Analytics 4?
If you answered no to any of the questions above, let’s take some time to get your analytics in shape. Google Analytics 4 is the analytics software of the future. Google has made no bones about the fact that anything new they develop will be in GA4 only. To take advantage of the new features, you need to get your house in order now.
So we’re offering you a Google Analytics 4 bootcamp. We’ll help you:
- Get your existing Google Analytics account in shape with proper goals, tracking cleanup, and best practices
- Identify key issues that will block your ability to use Google Analytics 4 and help resolve them
- Help set an analytics strategy for this that focuses on answers, decisions, and growth rather than pouring more data in your inbox
- Build a migration plan for Google Analytics 4, including Google Tag Manager and Google Data Studio
Click here to order a Google Analytics bootcamp »
Interested in sponsoring INBOX INSIGHTS? Contact us for sponsorship options to reach over 18,000 analytically-minded marketers and business professionals every week.

Where can you find us in person?
- MarketingProfs B2B Forum, October 2021, virtual
Going to a conference we should know about? Reach out!
Want some private training at your company? Ask us!

First and most obvious – if you want to talk to us about something specific, especially something we can help with, hit up our contact form.
Where do you spend your time online? Chances are, we’re there too, and would enjoy sharing with you. Here’s where we are – see you there?
- Our blog
- Slack
- YouTube
- In-Ear Insights on Apple Podcasts
- In-Ear Insights on Google Podcasts
- In-Ear Insights on all other podcasting software

Our Featured Partners are companies we work with and promote because we love their stuff. If you’ve ever wondered how we do what we do behind the scenes, chances are we use the tools and skills of one of our partners to do it.
- Hubspot CRM
- StackAdapt Display Advertising
- Agorapulse Social Media Publishing
- WP Engine WordPress Hosting
- Techsmith Camtasia and Snagit Media Editing
- Talkwalker Media Monitoring
- Marketmuse Professional SEO software
- Gravity Forms WordPress Website Forms
- Otter AI transcription
- Semrush Search Engine Marketing
- Our recommended media production gear on Amazon
Read our disclosures statement for more details, but we’re also compensated by our partners if you buy something through us.

Some events and partners have purchased sponsorships in this newsletter and as a result, Trust Insights receives financial compensation for promoting them. Read our full disclosures statement on our website.

Thanks for subscribing and supporting us. Let us know if you want to see something different or have any feedback for us!
|
Need help with your marketing AI and analytics? |
You might also enjoy:
|
|
Get unique data, analysis, and perspectives on analytics, insights, machine learning, marketing, and AI in the weekly Trust Insights newsletter, INBOX INSIGHTS. Subscribe now for free; new issues every Wednesday! |
Want to learn more about data, analytics, and insights? Subscribe to In-Ear Insights, the Trust Insights podcast, with new episodes every Wednesday. |


