INBOX INSIGHTS: Google Analytics Demographic Data, Instagram Performance, Server-Side Tagging (5/25) :: View in browser
Watch our free on-demand webinar, Customer Care Through the Customer Journey »
Are You Using Your Demographic Data?
This week I’ve been working with Chris to QA and finalize our new Google Analytics 4 course (coming soon!).
Something interesting happens when I do this quality assurance. I try to put myself in the place of the person learning this material for the first time. When I do that, I am reminded of all the things I’m not using for Trust Insights. In this case, demographics data from Google Analytics 4.
For a quick overview, this is how Google collects demographic data:
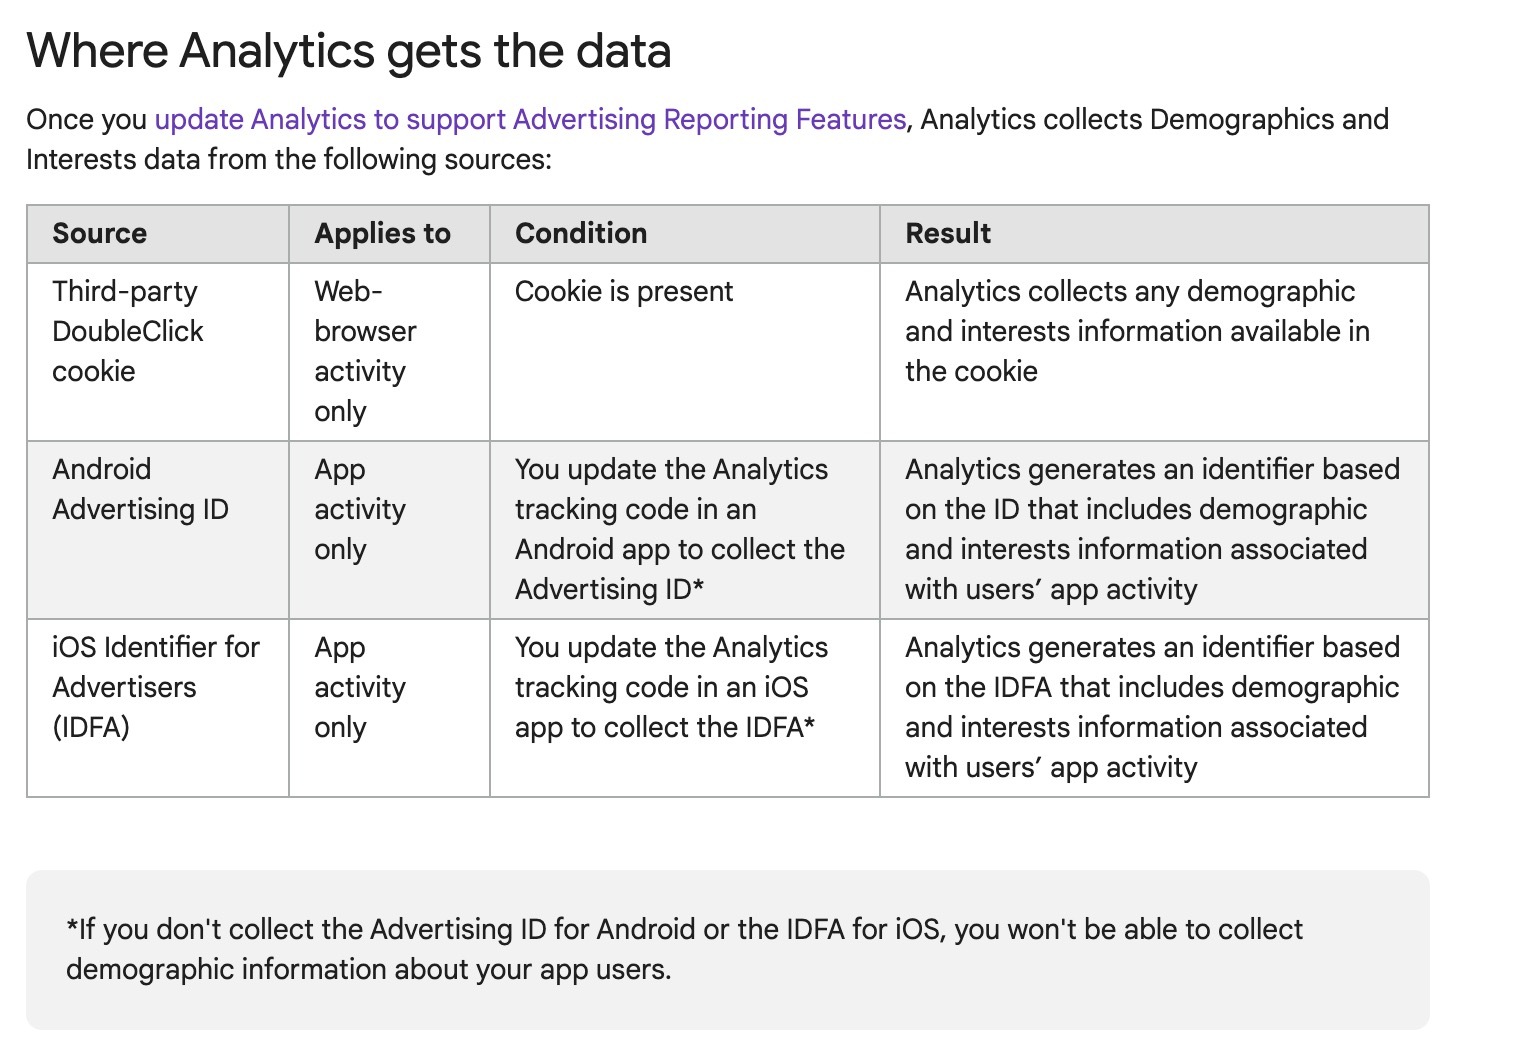
For the entire run down, you can visit this support page.
Now that we have that out of the way, let’s get into the good part. Why should you care about demographic data? If you’re like me you might get stuck in a rut when it comes to talking about what your business does. You are trying to find new and interesting ways to say the same thing, “we help you sort out your marketing data”.
It occurred to me while I was working through the GA4 course that we have an untapped well of ideas, which is the demographic data we collect. Specifically, interests.
Interests are broken out into broad categories such as fitness, travel, beauty, lifestyle, etc. When you look at it you might think, “what does that have to do with marketing data”? On its own, not a whole lot.
But there are two very strong use cases for this interest data:
Advertising Targeting
The categories in Google Analytics match the interest categories in Google Ads. You can do a 1-1 with your targeting. When you’re advertising on other ad systems, you can look for similar categories and use your Google Analytics interest data as a starting point.
Content Marketing
This is what I want to spend time talking about. Advertising targeting is all well and good but without a good ad or offer, you’re not going to sell anything. This is a snapshot of users that visit the Trust Insights website:
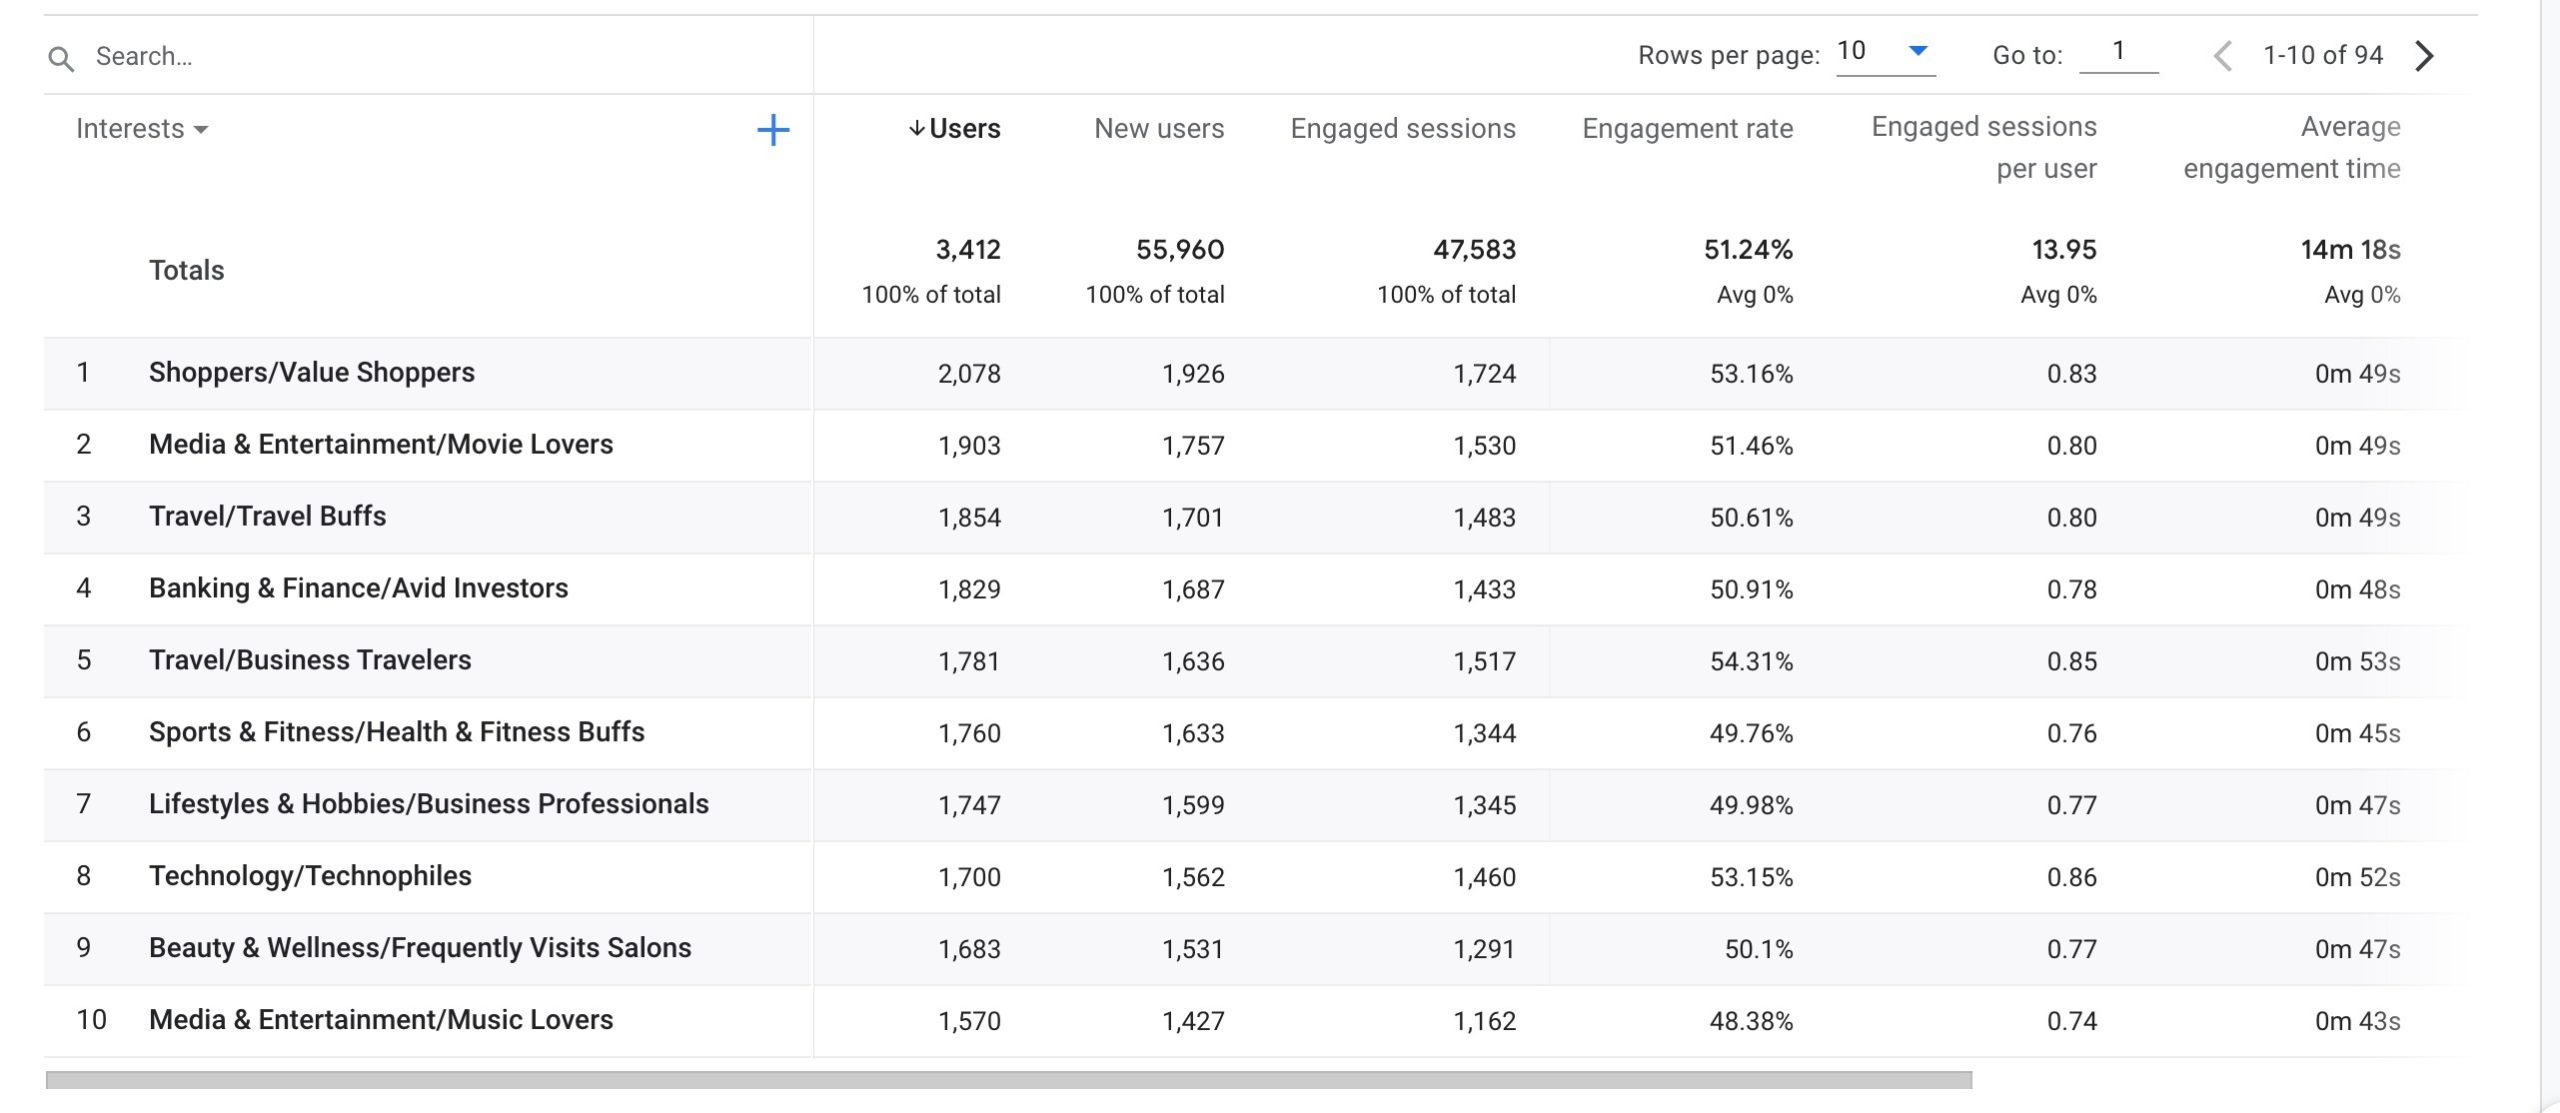
It’s a varied mix of interests. We have value shoppers, movie buffs, travel buffs, avid investors, and music lovers.
So what do we do with this? First, we need to remember that this is about promoting Trust Insights. What do we do? Change Management, Data Analysis, Strategies and Planning, and Digital Marketing Consulting. Now, the challenge that I have before me is to figure out how to combine that with the interests of the people that visit our site.
Let’s take music lovers. I could create content that analyzes data from sites like Spotify or Pandora (if it’s available). I could write about how artists approach marketing in the modern world. I could dissect some of my favorite songs and break down the trends and patterns of the music itself. All those ideas are on-brand for what we do at Trust Insights. It’s another way to demonstrate our capabilities.
And therein lies the “so what” – finding new and interesting ways to show your capabilities. You don’t always have to go in for the hard sell. You can write something entertaining and engaging. Give people a reason to stick around.
How are you using your demographic data?
Tell me in me in our free Slack Group, Analytics for Marketers »
– Katie Robbert, CEO

Do you have a colleague or friend who needs this newsletter? Send them this link to help them get their own copy:
https://www.trustinsights.ai/newsletter

In this week’s In-Ear Insights, Katie and Chris review the basics of what server-side tagging is, why it’s important, and how it works. Using Google Tag Manager’s server-side edition as the example, we look at why companies like Facebook are pushing it so much, and what benefits – and hurdles – server-side tagging presents. Tune in to find out!
Watch/listen to this episode of In-Ear Insights here »
Last week on So What? The Marketing Analytics and Insights Live show, we looked at durable and non-durable trends. How do you determine whether you can accurately forecast something? Catch the replay here »
This Thursday at 1 PM Eastern, we’ll be looking at UTM code governance in Google Analytics 4. Are you following our YouTube channel? If not, click/tap here to follow us!
Need a reminder? Click here for a calendar appointment:

Here’s some of our content from recent days that you might have missed. If you read something and enjoy it, please share it with a friend or colleague!
- News about Google Analytics 4
- {PODCAST} In-Ear Insights: The Power and Danger of Recommendation Engines
- So What? Durable and non-durable trends
- The Best Day and Time to Issue a Wire Service Press Release (2022 Data)
- What Can We Learn From Political Ad Data?
- INBOX INSIGHTS, May 18, 2022: The Unaware Audience, Micro-Forecasting, Recommendation Engines

Take your skills to the next level with our premium courses.

Get skilled up with an assortment of our free, on-demand classes.
- How to Deliver Reports and Prove the ROI of your Agency
- Powering Up Your LinkedIn Profile (For Job Hunters)
- Competitive Social Media Analytics Strategy
- How to Prove Social Media ROI
- What, Why, How: Foundations of B2B Marketing Analytics

In this week’s Data Diaries, we revisit our old friend Instagram. It’s been a tumultuous couple of months in the social media landscape; let’s see how brands and influencers are faring on the network. We’ll start with brands first; how have brands fared in 2022 for unpaid content performance?
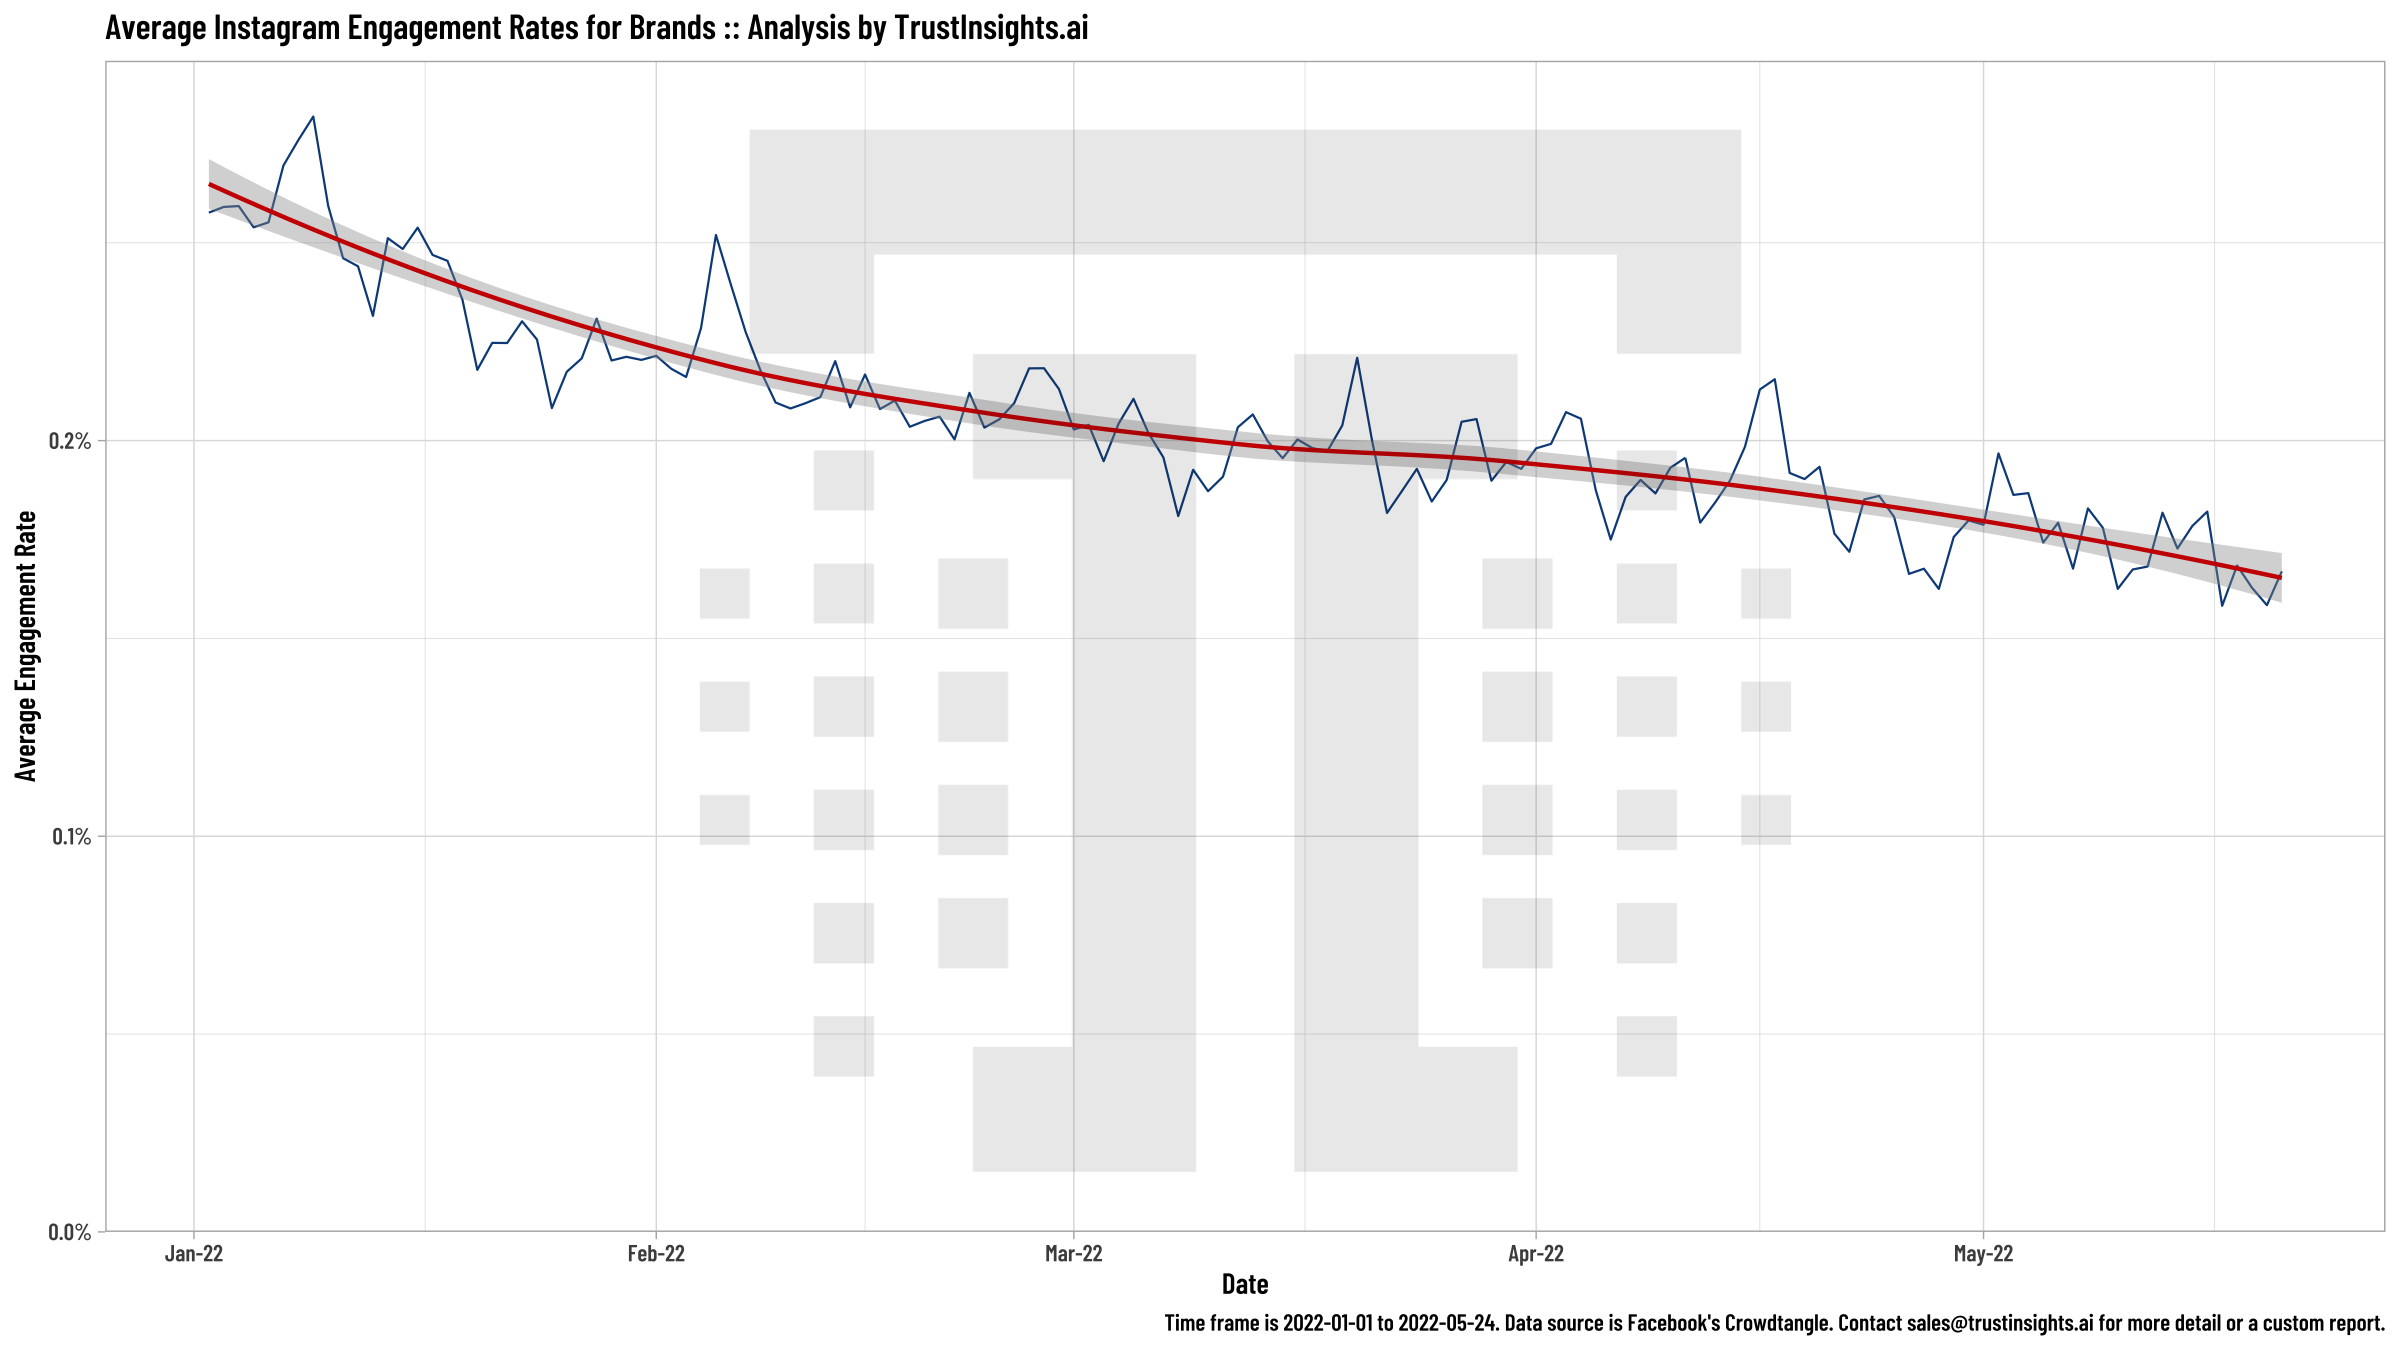
Unsurprisingly, as has been the case for as many years as we’ve been analyzing the data, unpaid brand engagement continues to decline over time, currently averaging around 0.16%. At its current rate of decay, brands will likely see engagement drop to 0.1% by the end of the year. For context, that means 1 out of 1,000 followers on Instagram are likely to engage with branded content.
Let’s take a look at media types for brands:
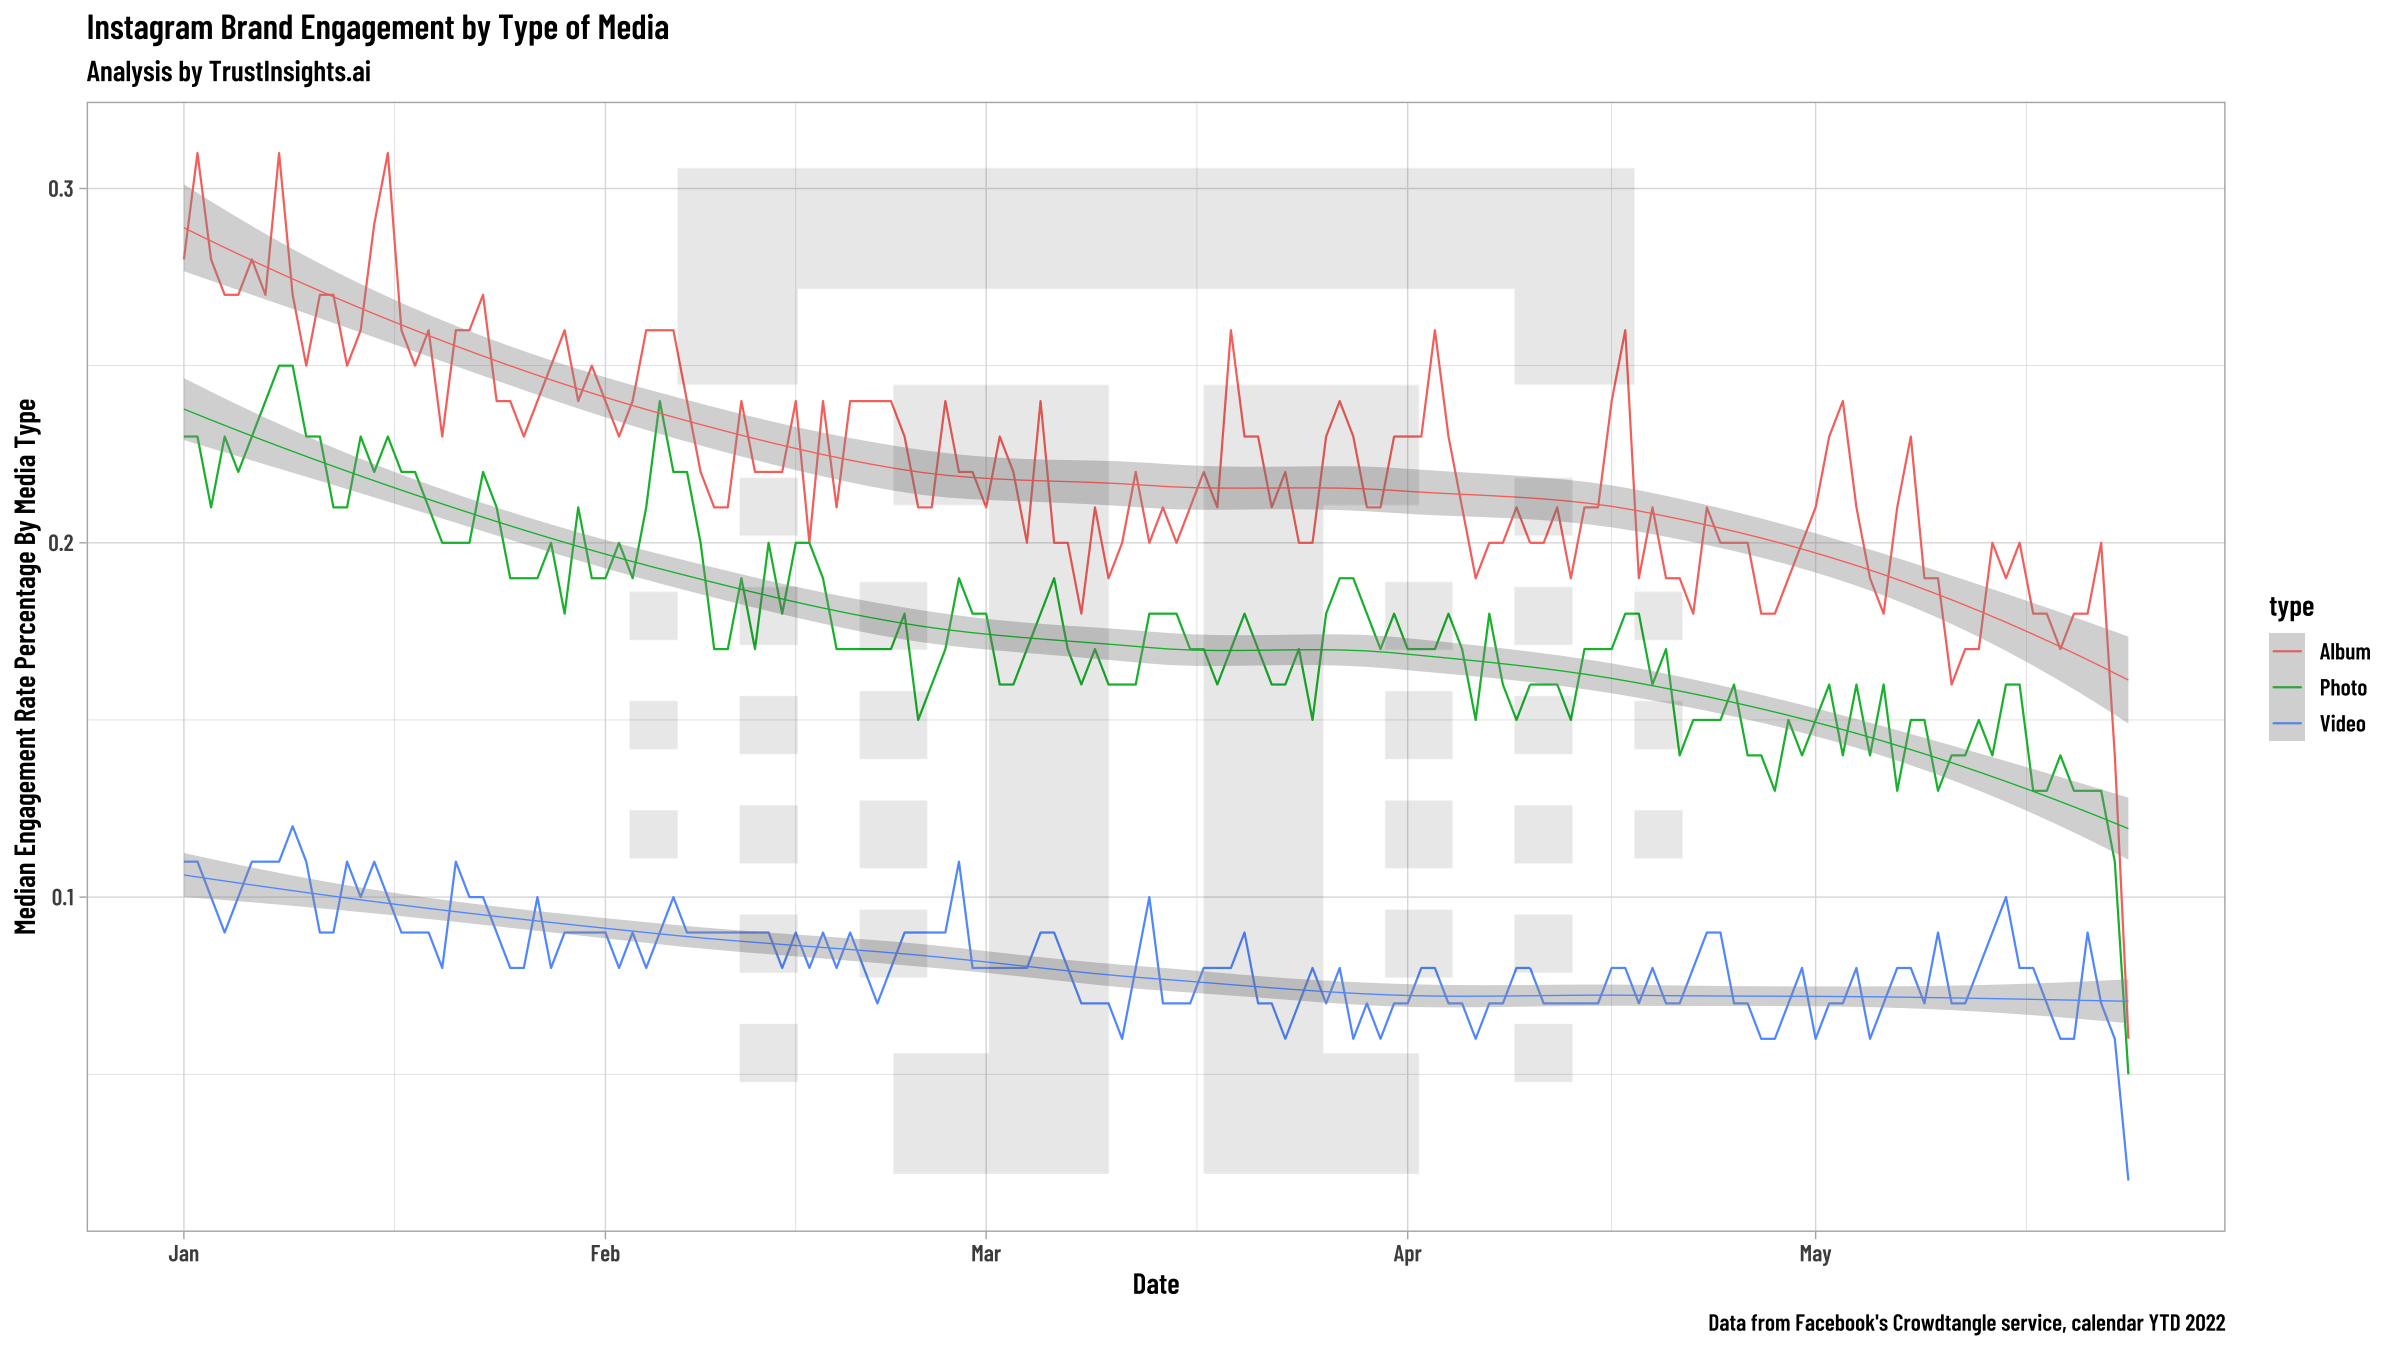
What we see is that video overall remains roughly steady as the lowest performing media format. For brands, we see that albums – carousels – still perform best of the unpaid media types available.
Let’s switch our view to influencers:
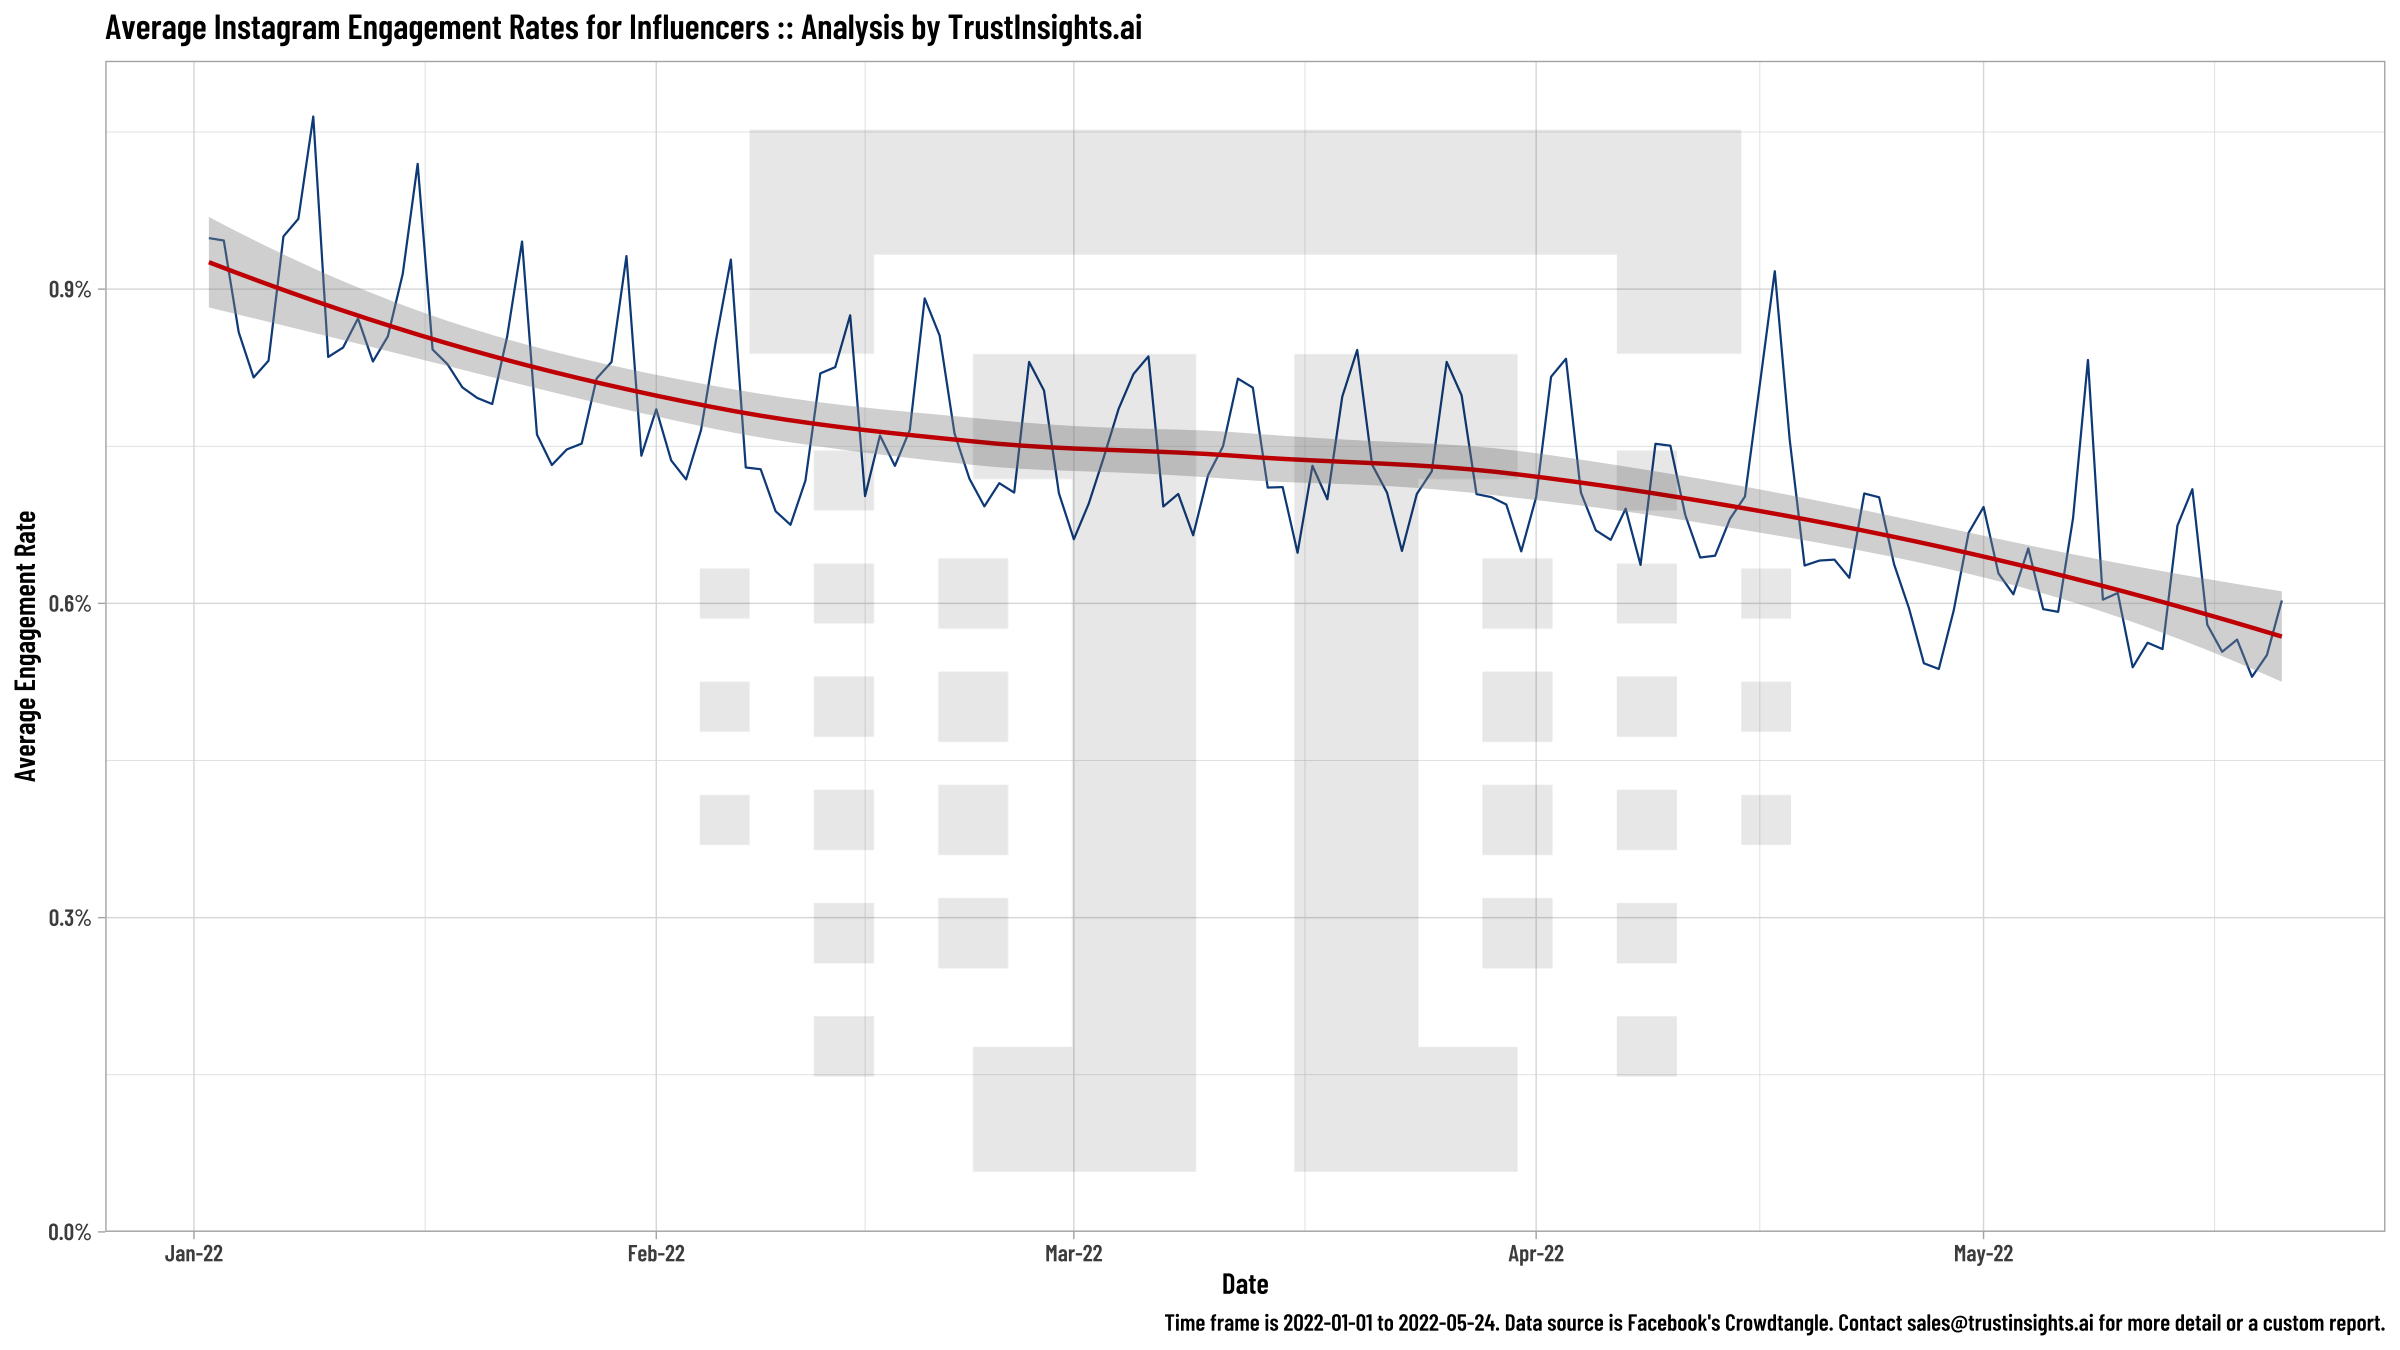
Influencers see the same decline as brands; though their overall engagement rate remains about 3x what brands earn, it’s fallen far from the 3-5% it used to be a few years ago. Today, influencer accounts can expect about 0.8% engagement on their unpaid content.
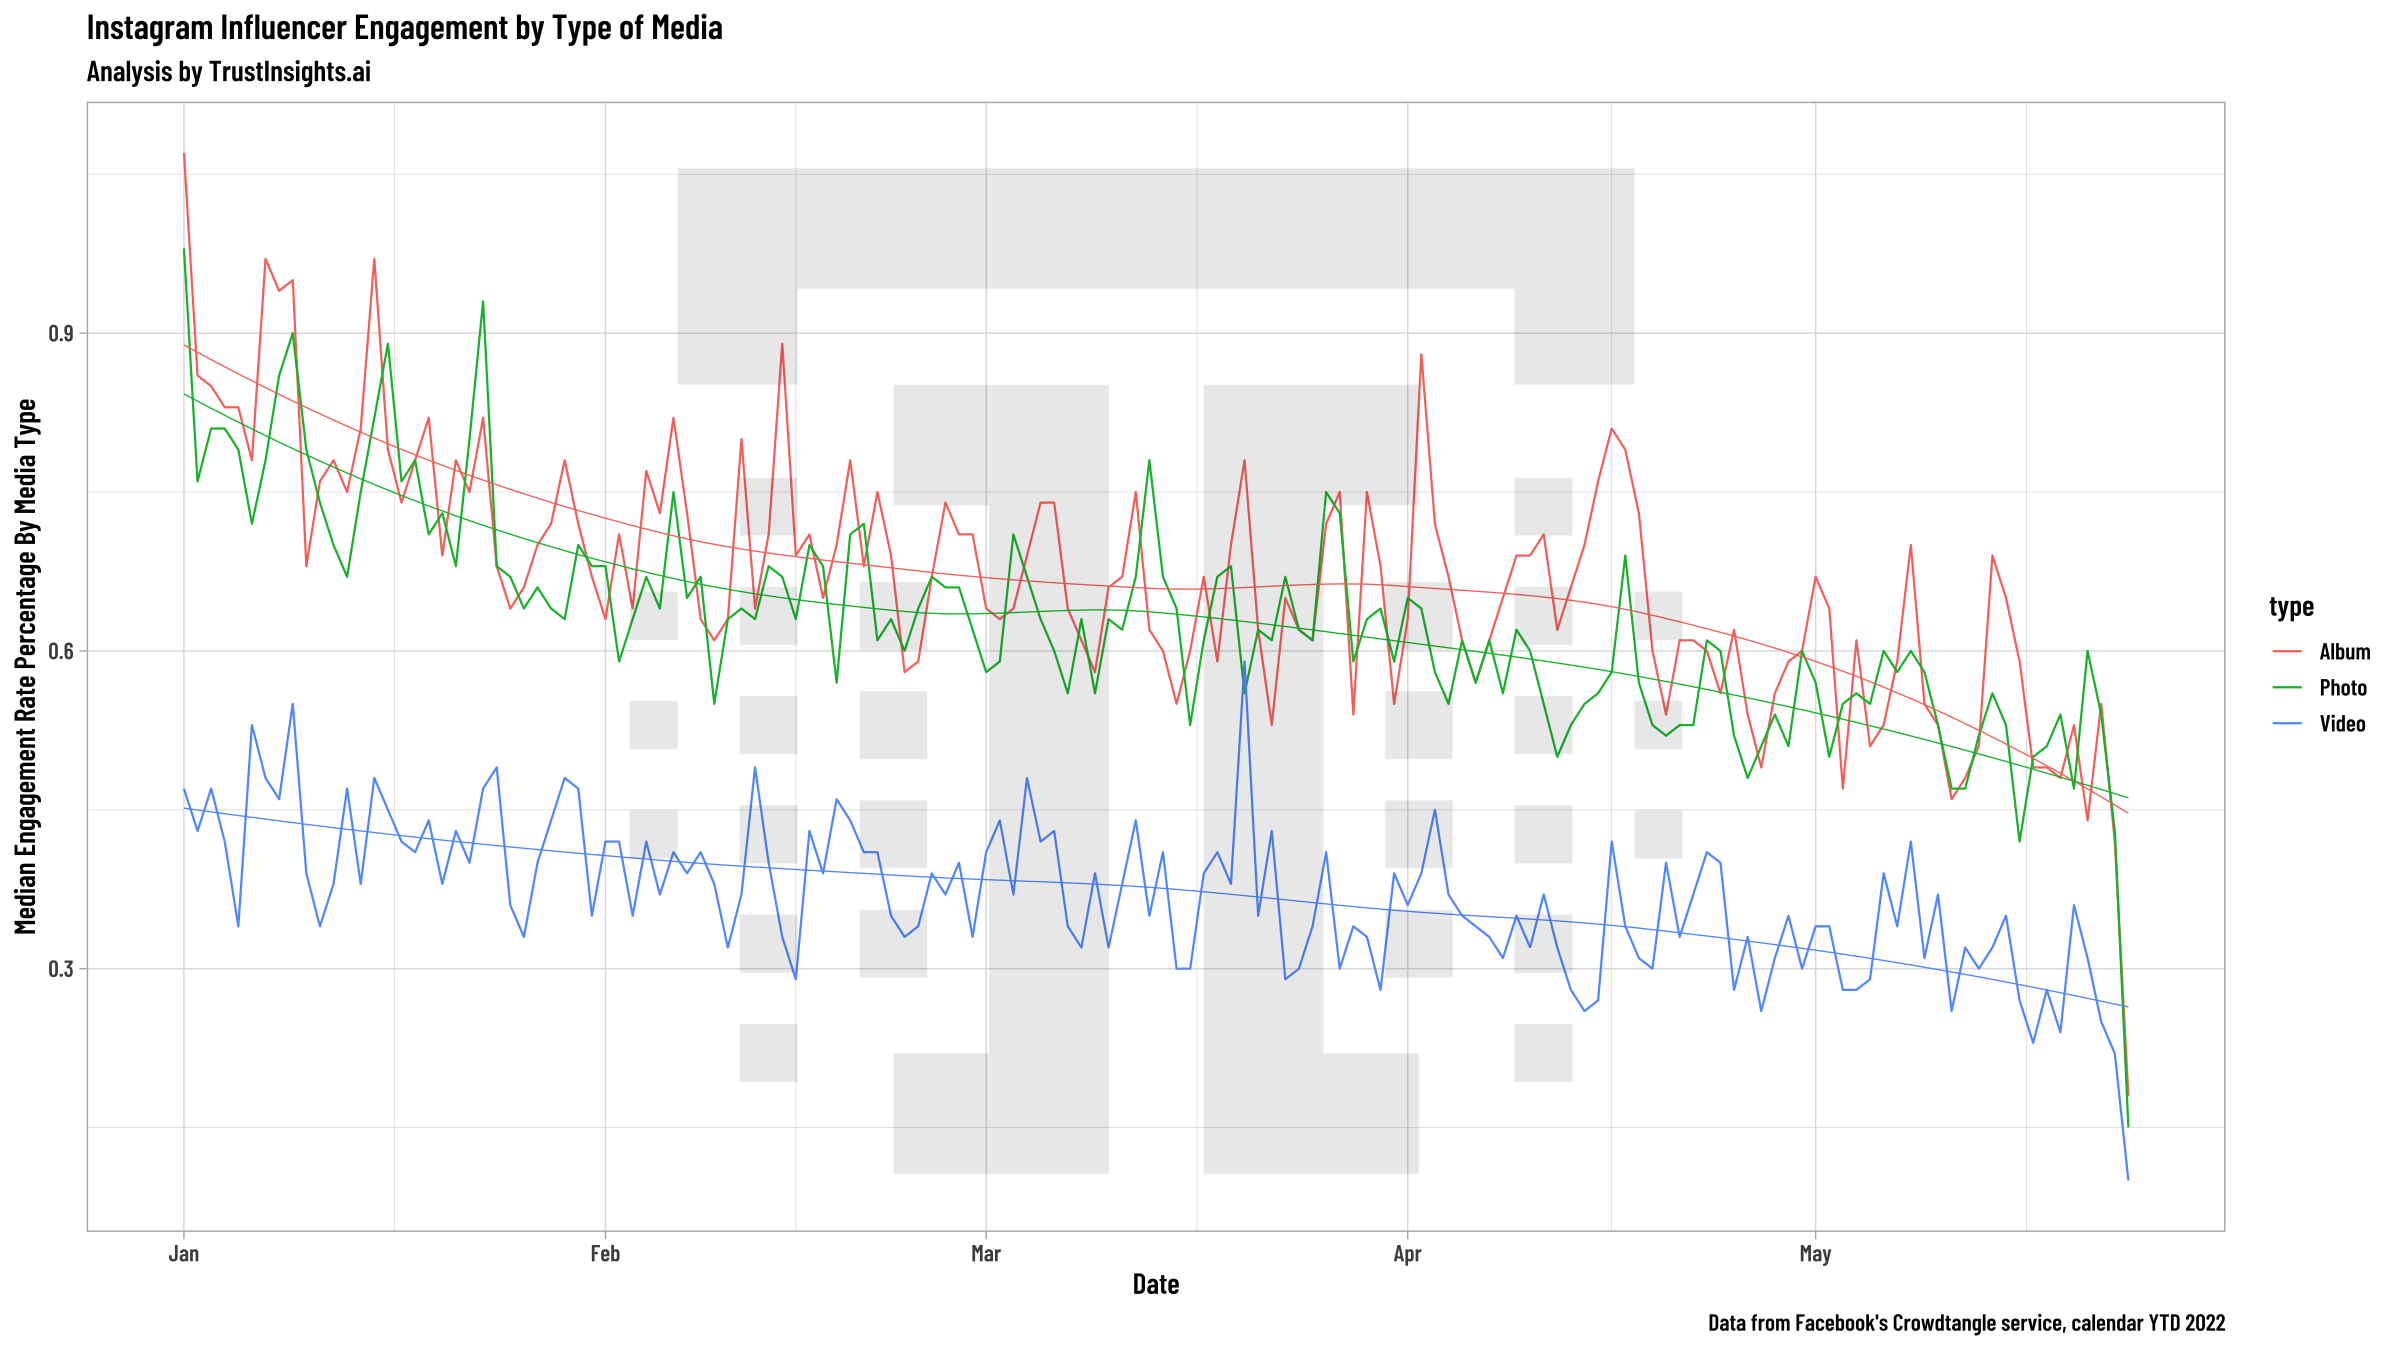
What’s interesting here is that albums and photos match each other in engagement rates; for brands, we saw that albums led photos by a significant margin, but for influencers, that’s not true.
So what? What do we do with all this information? Many marketers use these benchmarks to assess their own performance, and to vet potential influencers. If the influencer you’re interested in engaging is substantially below these basic benchmarks, you’d negotiate a different kind of agreement. If your own brand performance is below these benchmarks, perhaps a change in strategy or platform is called for.
What we also see is that regardless of brand or influencer, regardless of media type, Instagram performance across the board continues to decline for unpaid content. As with Facebook, we are approaching numbers where we should be evaluating whether investing in unpaid content is even worthwhile on these platforms, or whether we should be putting our time, effort, and resources into platforms that perform better.
Disclosures and Methodology: Trust Insights extracted 1,141,751 Instagram posts from 7,372 brands and 462,744 posts from 9,981 influencers using Meta’s Crowdtangle service. Engagement is defined as likes + comments / size of audience. Posts were de-duplicated using the post URL. The timeframe of the data is January 1 1 – May 24, 2022. The date of study is May 24, 2022. Trust Insights is the sole sponsor of the study and neither gave nor received compensation for data used, beyond applicable service fees to software vendors, and declares no competing interests.

- New! Case Study: Exploratory Data Analysis and Natural Language Processing
- Case Study: Google Analytics Audit and Attribution
- Case Study: Natural Language Processing
- Case Study: SEO Audit and Competitive Strategy

This is a roundup of the best content you and others have written and shared in the last week.
SEO, Google, and Paid Media
- 7 Ways To Tweak Your Content For Better SEO
- How Data Is Reshaping The SEO & Digital Marketers Landscape
- 5 Things to Consider When Creating an SEO Content Strategy
Social Media Marketing
- You Ask, I Answer: Social Media Metrics in Google Analytics?
- 6 Ways Data Analytics Can Improve Targeting with LinkedIn Ads
- Fake Accounts and Bots: Is Marketing on Twitter Worth It?
Content Marketing
- What kind of content should you create to market your agency?
- How to Develop a Successful Content Marketing Strategy in 11 Steps via Compose.ly
- Stop Making These Reporting Mistakes To Keep Your Content Budget
Data Science and AI
- Artificial Intelligence Examples-Quick View via R-bloggers
- A Comprehensive Survey on Trustworthy Graph Neural Networks: Privacy, Robustness, Fairness, and Explainability via KDnuggets
- Using marketing analytics to drive superior growth via McKinsey

Are you a member of our free Slack group, Analytics for Marketers? Join 2400+ like-minded marketers who care about data and measuring their success. Membership is free – join today. Members also receive sneak peeks of upcoming data, credible third-party studies we find and like, and much more. Join today!

Customer care. The term conjures up the mental image of a bored employee answering calls in a call center, but the reality is that customer care is a core part of customer experience and goes far beyond traditional customer service. In this free on-demand webinar from Trust Insights and B Squared Media, learn:
- What modern customer journeys look like
- Where customer care fits into each stage of the customer journey for maximum impact
- How to leverage social listening in the customer journey
- How to identify content appropriate for each stage of the customer journey
Click/tap here to watch the on-demand recording »
Interested in sponsoring INBOX INSIGHTS? Contact us for sponsorship options to reach over 22,000 analytically-minded marketers and business professionals every week.

Where can you find Trust Insights face-to-face?
- Spark.me Conference, June 2022, Montenegro
- MarTech Conference, June 2022, virtual
- MAICON, August 2022, Cleveland, OH – use code PENN150 for $150 off any conference ticket
- Content Marketing World, September 2022, Cleveland
- MarketingProfs B2B Forum, October 2022, Boston
Going to a conference we should know about? Reach out!
Want some private training at your company? Ask us!

First and most obvious – if you want to talk to us about something specific, especially something we can help with, hit up our contact form.
Where do you spend your time online? Chances are, we’re there too, and would enjoy sharing with you. Here’s where we are – see you there?
- Our blog
- Slack
- YouTube
- In-Ear Insights on Apple Podcasts
- In-Ear Insights on Google Podcasts
- In-Ear Insights on all other podcasting software

Our Featured Partners are companies we work with and promote because we love their stuff. If you’ve ever wondered how we do what we do behind the scenes, chances are we use the tools and skills of one of our partners to do it.
- Hubspot CRM
- StackAdapt Display Advertising
- Agorapulse Social Media Publishing
- WP Engine WordPress Hosting
- Techsmith Camtasia and Snagit Media Editing
- Talkwalker Media Monitoring
- Marketmuse Professional SEO software
- Gravity Forms WordPress Website Forms
- Otter AI transcription
- Semrush Search Engine Marketing
- Our recommended media production gear on Amazon
Read our disclosures statement for more details, but we’re also compensated by our partners if you buy something through us.

Some events and partners have purchased sponsorships in this newsletter and as a result, Trust Insights receives financial compensation for promoting them. Read our full disclosures statement on our website.

Thanks for subscribing and supporting us. Let us know if you want to see something different or have any feedback for us!
|
Need help with your marketing AI and analytics? |
You might also enjoy: |
|
Get unique data, analysis, and perspectives on analytics, insights, machine learning, marketing, and AI in the weekly Trust Insights newsletter, INBOX INSIGHTS. Subscribe now for free; new issues every Wednesday! |
Want to learn more about data, analytics, and insights? Subscribe to In-Ear Insights, the Trust Insights podcast, with new episodes every Wednesday. |


