Introduction
Welcome to the 12 Days of Data 2022 Edition, our look back at the data that made marketing in 2022. We’re looking at the year that was (and oh, what a year it was, something we’ve been saying for three years straight now…) from an analytics perspective to see what insights we can take into the next year. Sit up, get your coffee ready, and let’s celebrate some data and look forward to the year ahead.
[12days2022]
Instagram for Brands Engagement – Unpaid Content
We start day 2 of the 12 Days of Data with Instagram, Facebook’s visual social media network. It used to be photos. Then photos and album. Then videos. Then Instagram live. Then Instagram TV. Then Stories. Then Reels. As competing social networks came up with new, popular features, Facebook did its best to copy them, and today’s Instagram Frankenstein monster is the result.
Using a curated list provided by Crowdtangle (a Facebook company) and then manually inspected and augmented by Trust Insights, we started with a sample size of 7,460 Instagram brand accounts. Based on that data, we wanted to see what Instagram brand engagement looked like for 2022.
Before we go further, we define engagement as the number of interactions (reactions, comments, shares) that occurred on an unpaid, unsponsored Instagram brand post, divided by the number of followers of that Instagram brand account at the time of posting. For all the computations that follow, we use the median as the measure of centrality, rather than the mean (average) because medians deal better with outliers, especially in large social media datasets.
How have brands fared on Instagram in 2022?
Key Statistics
Let’s start with the high-level summary. In 2022, brands had:
- A median of 687,749 followers on their accounts, an increase of 32.8% year over year
- A median of 913 likes on their posts, a decrease of 24.4% year over year
- A median of 12 comments on their posts, a decrease of 25% year over year
- A median engagement rate of 0.18% per post, a decrease of 41.9% year over year
Put another way, 1 out of every 556 followers engaged in some way with unpaid brand content.
That number doesn’t tell the whole story, however. Let’s look at how unpaid brand content performed throughout 2022:

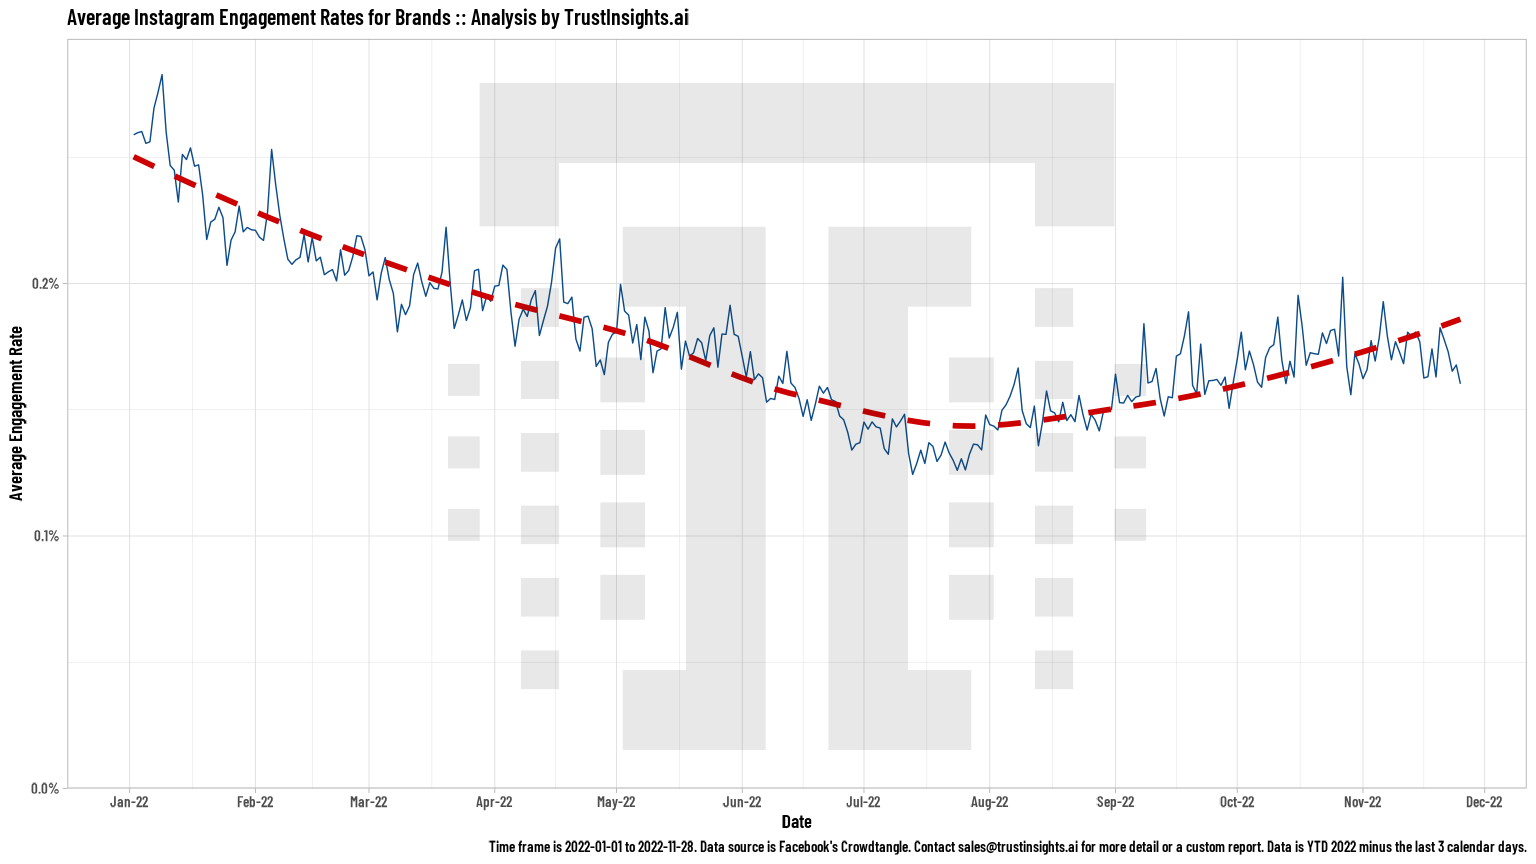
As seen above, the engagement rates for unpaid brand content started 2022 at 0.25% before dropping to a low of 0.15% in the middle of the year, rebounding a little recently to 0.175% in recent days.
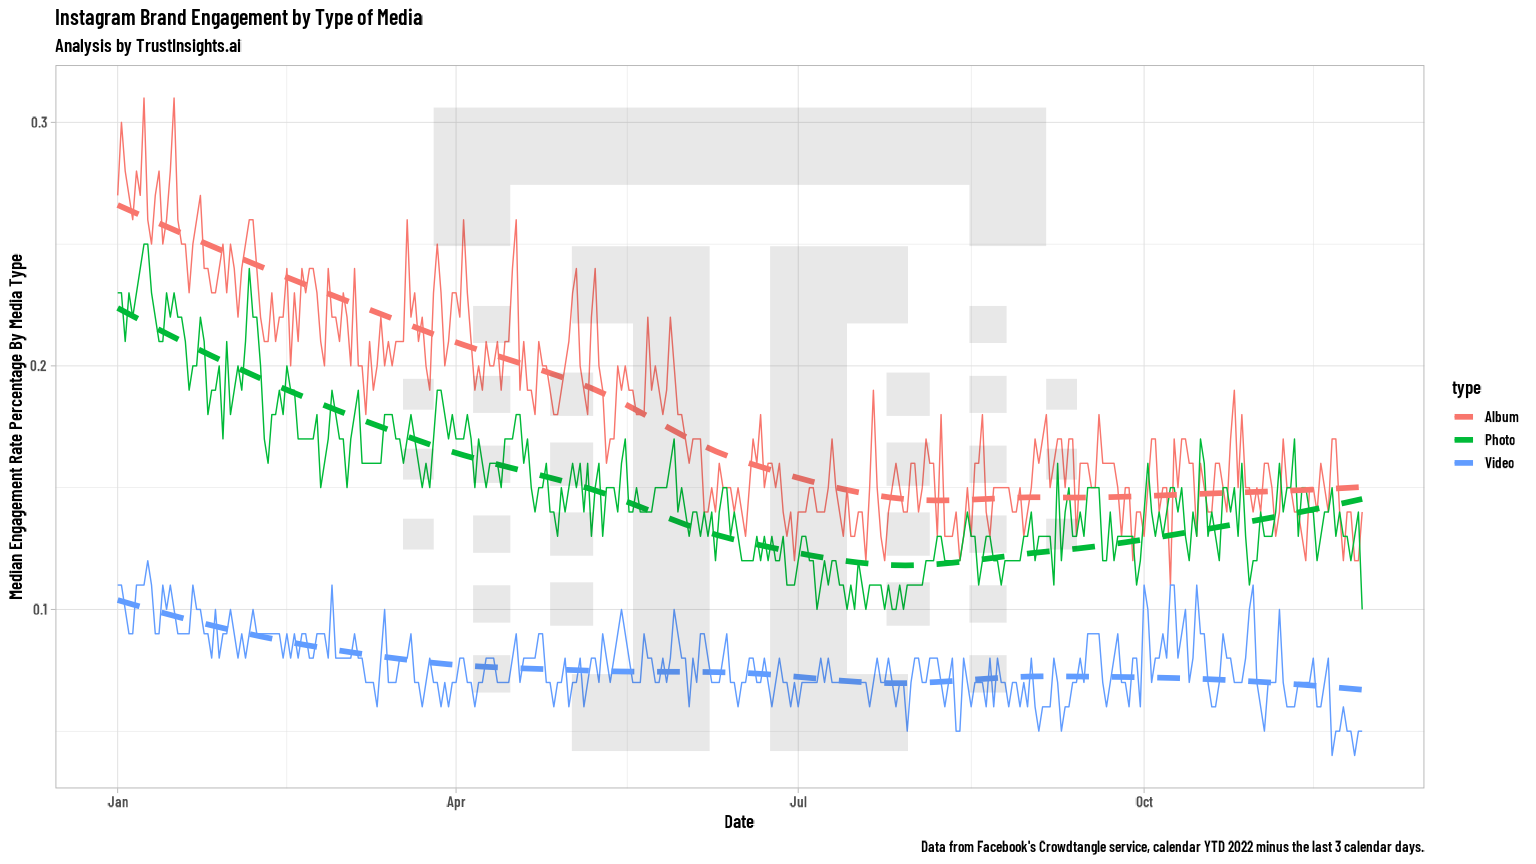
When we examine the media types that performed best for brands, we see even more nuance:
 For the past few years, albums (carousels) have far outpaced the engagement of photos and videos. While videos (which now include Reels) have remained in the engagement doldrums, photos have improved in recent days to be on par with albums.
So What?
For the past few years, we’ve advocated that brands spread out their efforts on different channels, as every year, brands lost ground, lost traction on Instagram. While that’s still true in an absolute sense on Instagram in 2022, there are some encouraging signs in brand engagement that might warrant a bit more scrutiny.
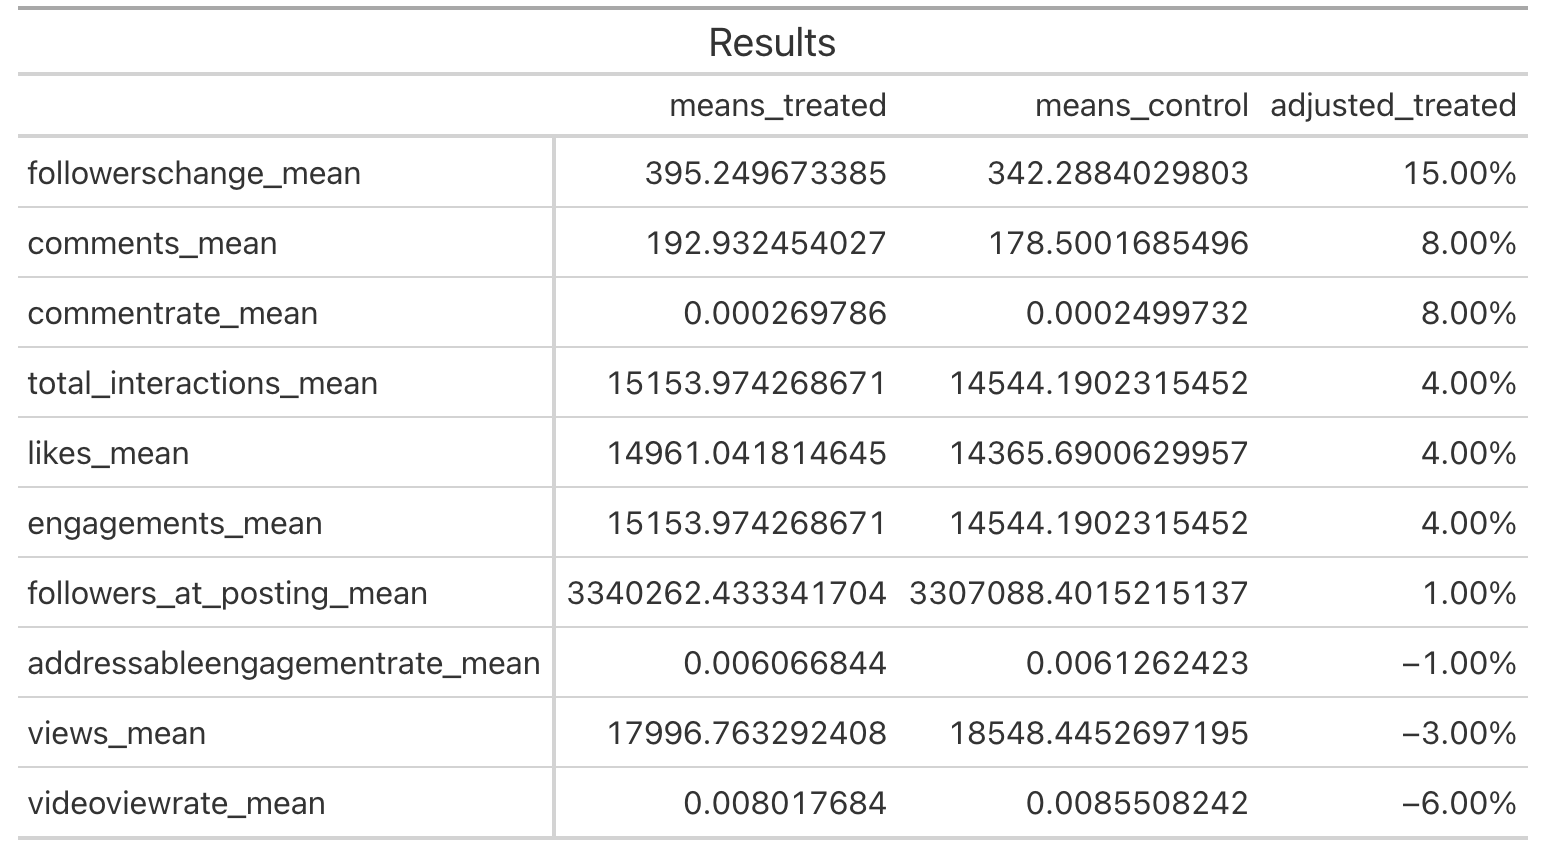
Additionally, with big changes on other social networks, Instagram stands to benefit. When we examine brand engagement rates and data on Instagram before vs. after the change in management at Twitter, we find some surprising statistics:
 What we see is that compared to similar days prior to the change in management at Twitter, brands are enjoying 15% more follower growth, 8% more comments, and 4% more likes. That’s unsurprising; people leaving one social network have to go somewhere else, and Instagram is one of the beneficiaries.
So what should you do? Based on our findings, brands should continue to experiment on Instagram, particularly with all the new content formats. Use Stories to promote Reels. Use Reels to communicate in short, compact videos. Anchor Reels content with photos and albums. And engage with your followers; when people comment, talk to them. Bring back the social in social media.
At the end of the day, no one social network should be so essential to your brand that your marketing effectiveness is endangered by changes to the platform. If that’s the case, diversifying away from that one network is critical as long-term insurance for your marketing’s effectiveness. It’s unclear how long the halo effect will be for Instagram from changes at other social networks, but take advantage now of brands’ increased efficacy on the network while it lasts.
Methodology Statement
Trust Insights used Facebook’s Crowdtangle software to extract 2,387,303 unique posts from 7,460 brands on Instagram. The timeframe of the dataset is 1 January 2022 – 1 December 2022. Trust Insights is the sole sponsor of the study and neither gave nor received compensation for data used, beyond applicable service fees to software vendors, and declares no competing interests.
[12days2022]
|
Need help with your marketing AI and analytics? |
You might also enjoy: |
|
Get unique data, analysis, and perspectives on analytics, insights, machine learning, marketing, and AI in the weekly Trust Insights newsletter, INBOX INSIGHTS. Subscribe now for free; new issues every Wednesday! |
Want to learn more about data, analytics, and insights? Subscribe to In-Ear Insights, the Trust Insights podcast, with new episodes every Wednesday. |


