This data was originally featured in the April 20, 2022 newsletter found here: https://www.trustinsights.ai/blog/2022/04/inbox-insights-april-20-2022-data-governance-working-from-home-marketing-myths/
In this week’s Data Diaries, let’s look at working from home. At the start of the pandemic, most companies had to figure out how to move employee work to remote work as quickly and as safely as possible, when it was possible. Much was made of the future of work.
That begs the question, how’s that going? The Census Bureau added a new question to their monthly survey of US citizens in May of 2020:
“At any time in the last 4 weeks, did you telework or work at home for pay because of the coronavirus pandemic?”

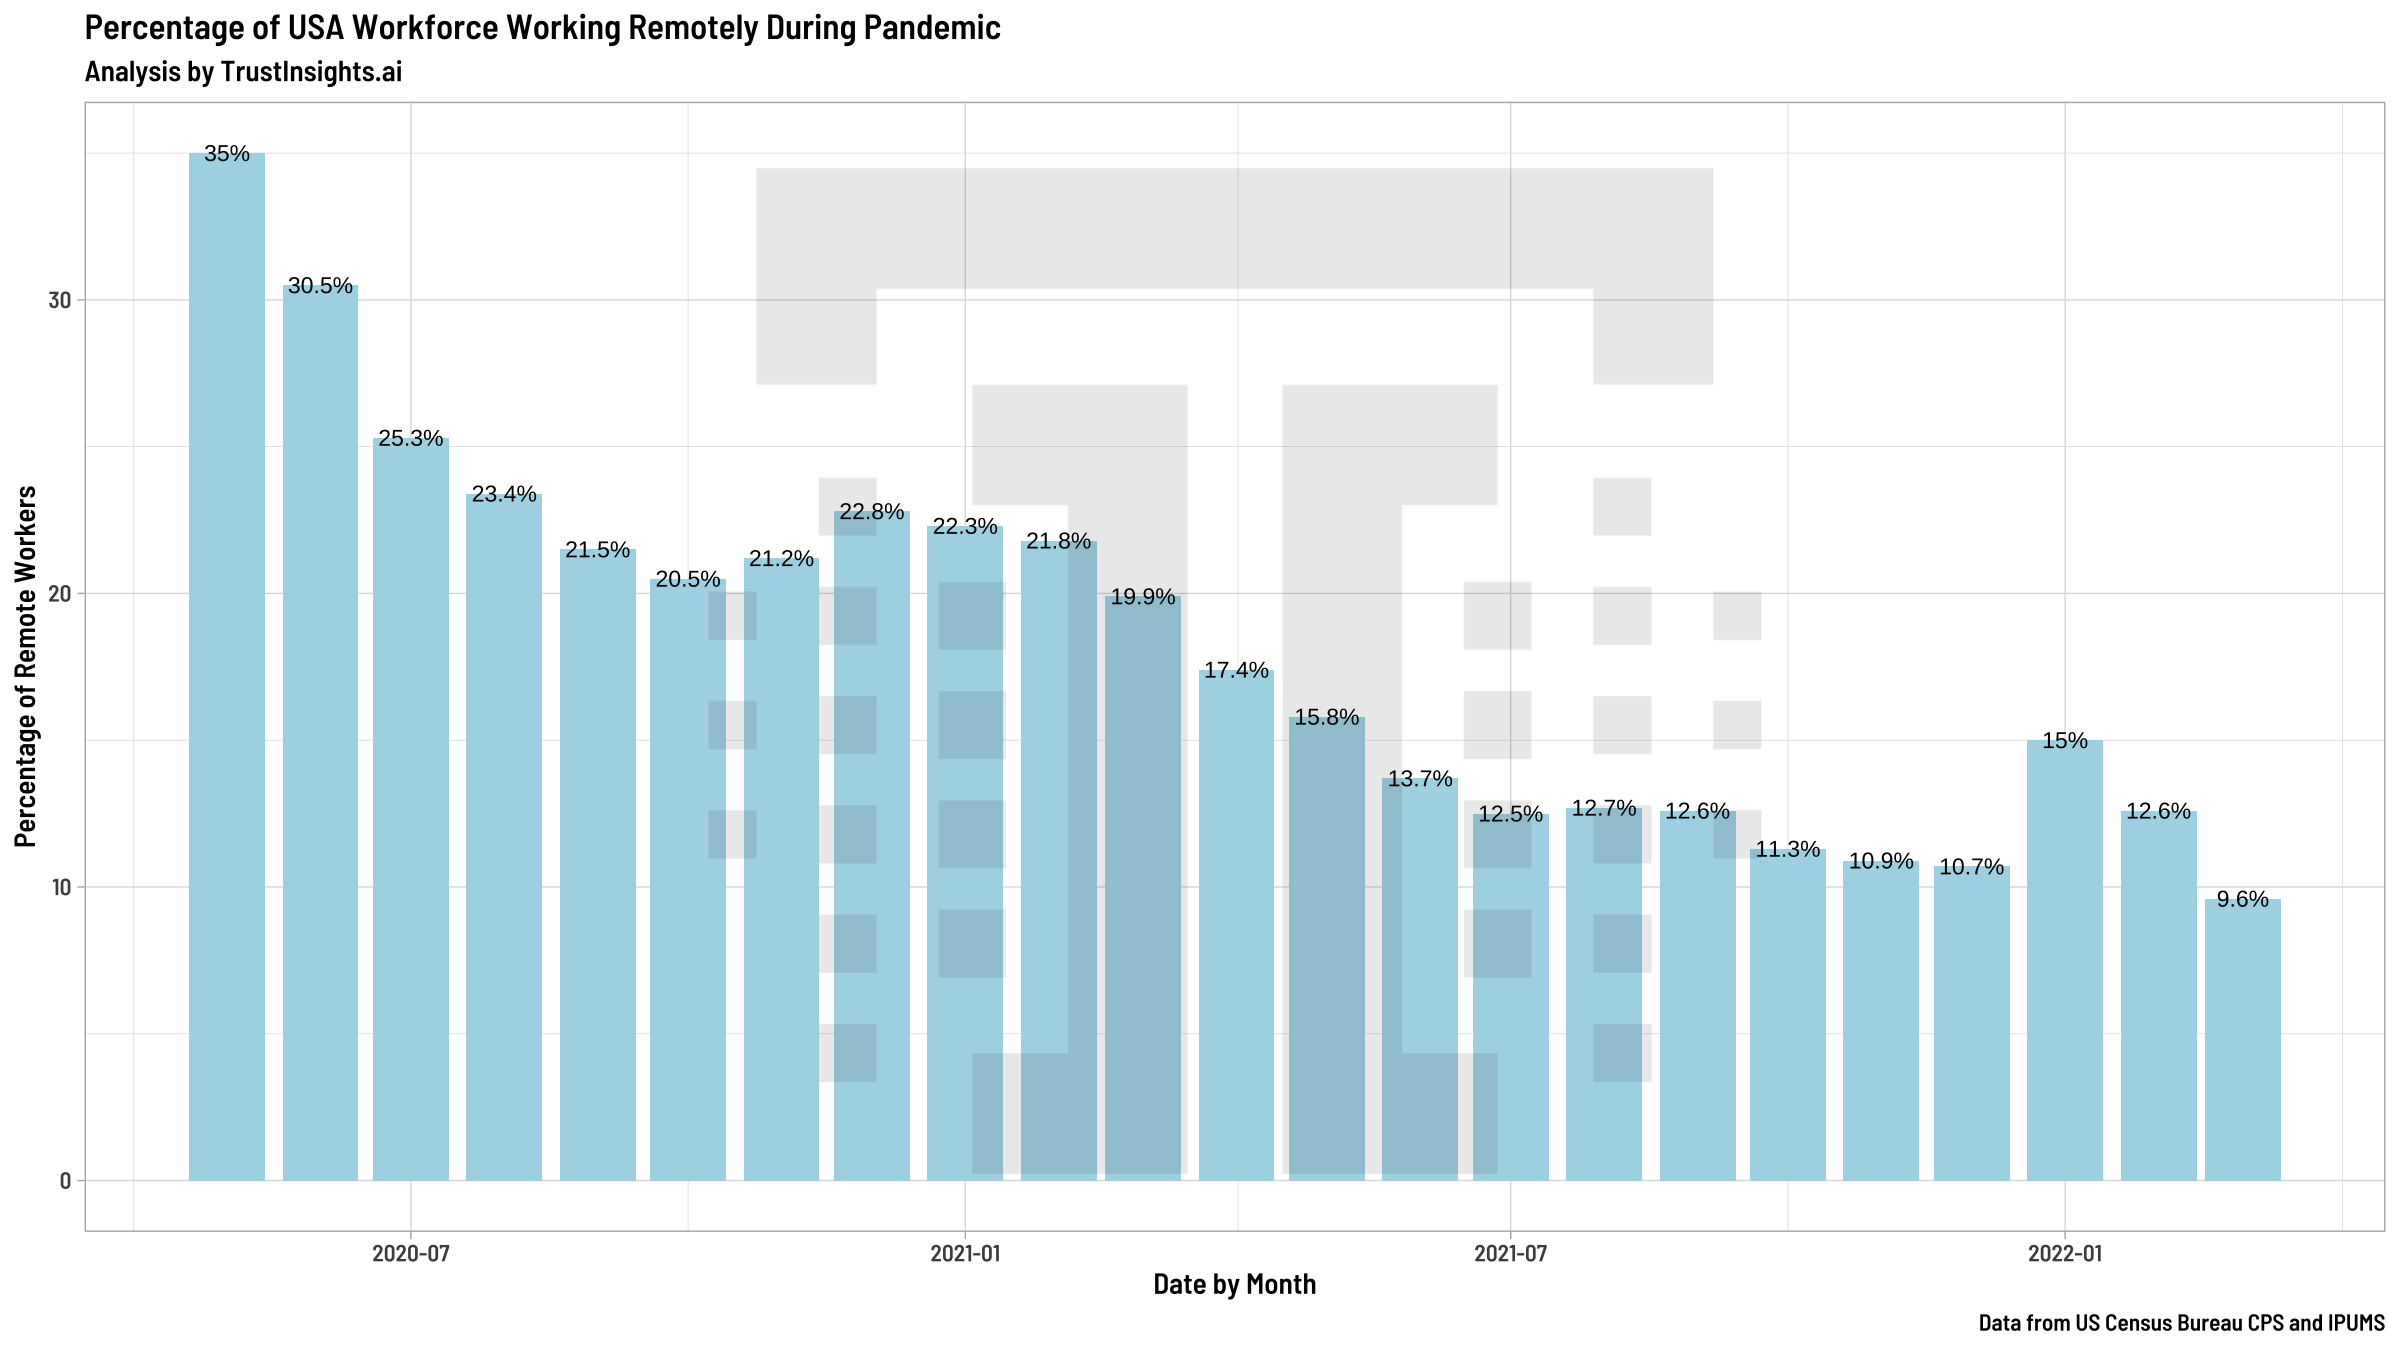
What we see in the data matches the real world; in the first few months of the pandemic, employees worked from home quite a bit. We saw a lessening over the summer of 2020 and then an increase as the Delta wave hit. Beginning in April 2021, we see a dramatic drop in working remotely as vaccines rolled out to the general population, and then a spike again in January 2022 with the winter Omicron wave. As of March 2022, we’re now at the lowest point in terms of responses to this survey.
It’s important to note that this survey question isn’t about working from home generally. It’s specific to the pandemic itself. What the data tells us is that people feel less of a need to work remotely because of the pandemic now than at any time thus far; for much of the USA workforce, the pandemic is “over” in terms of it compelling working from home.
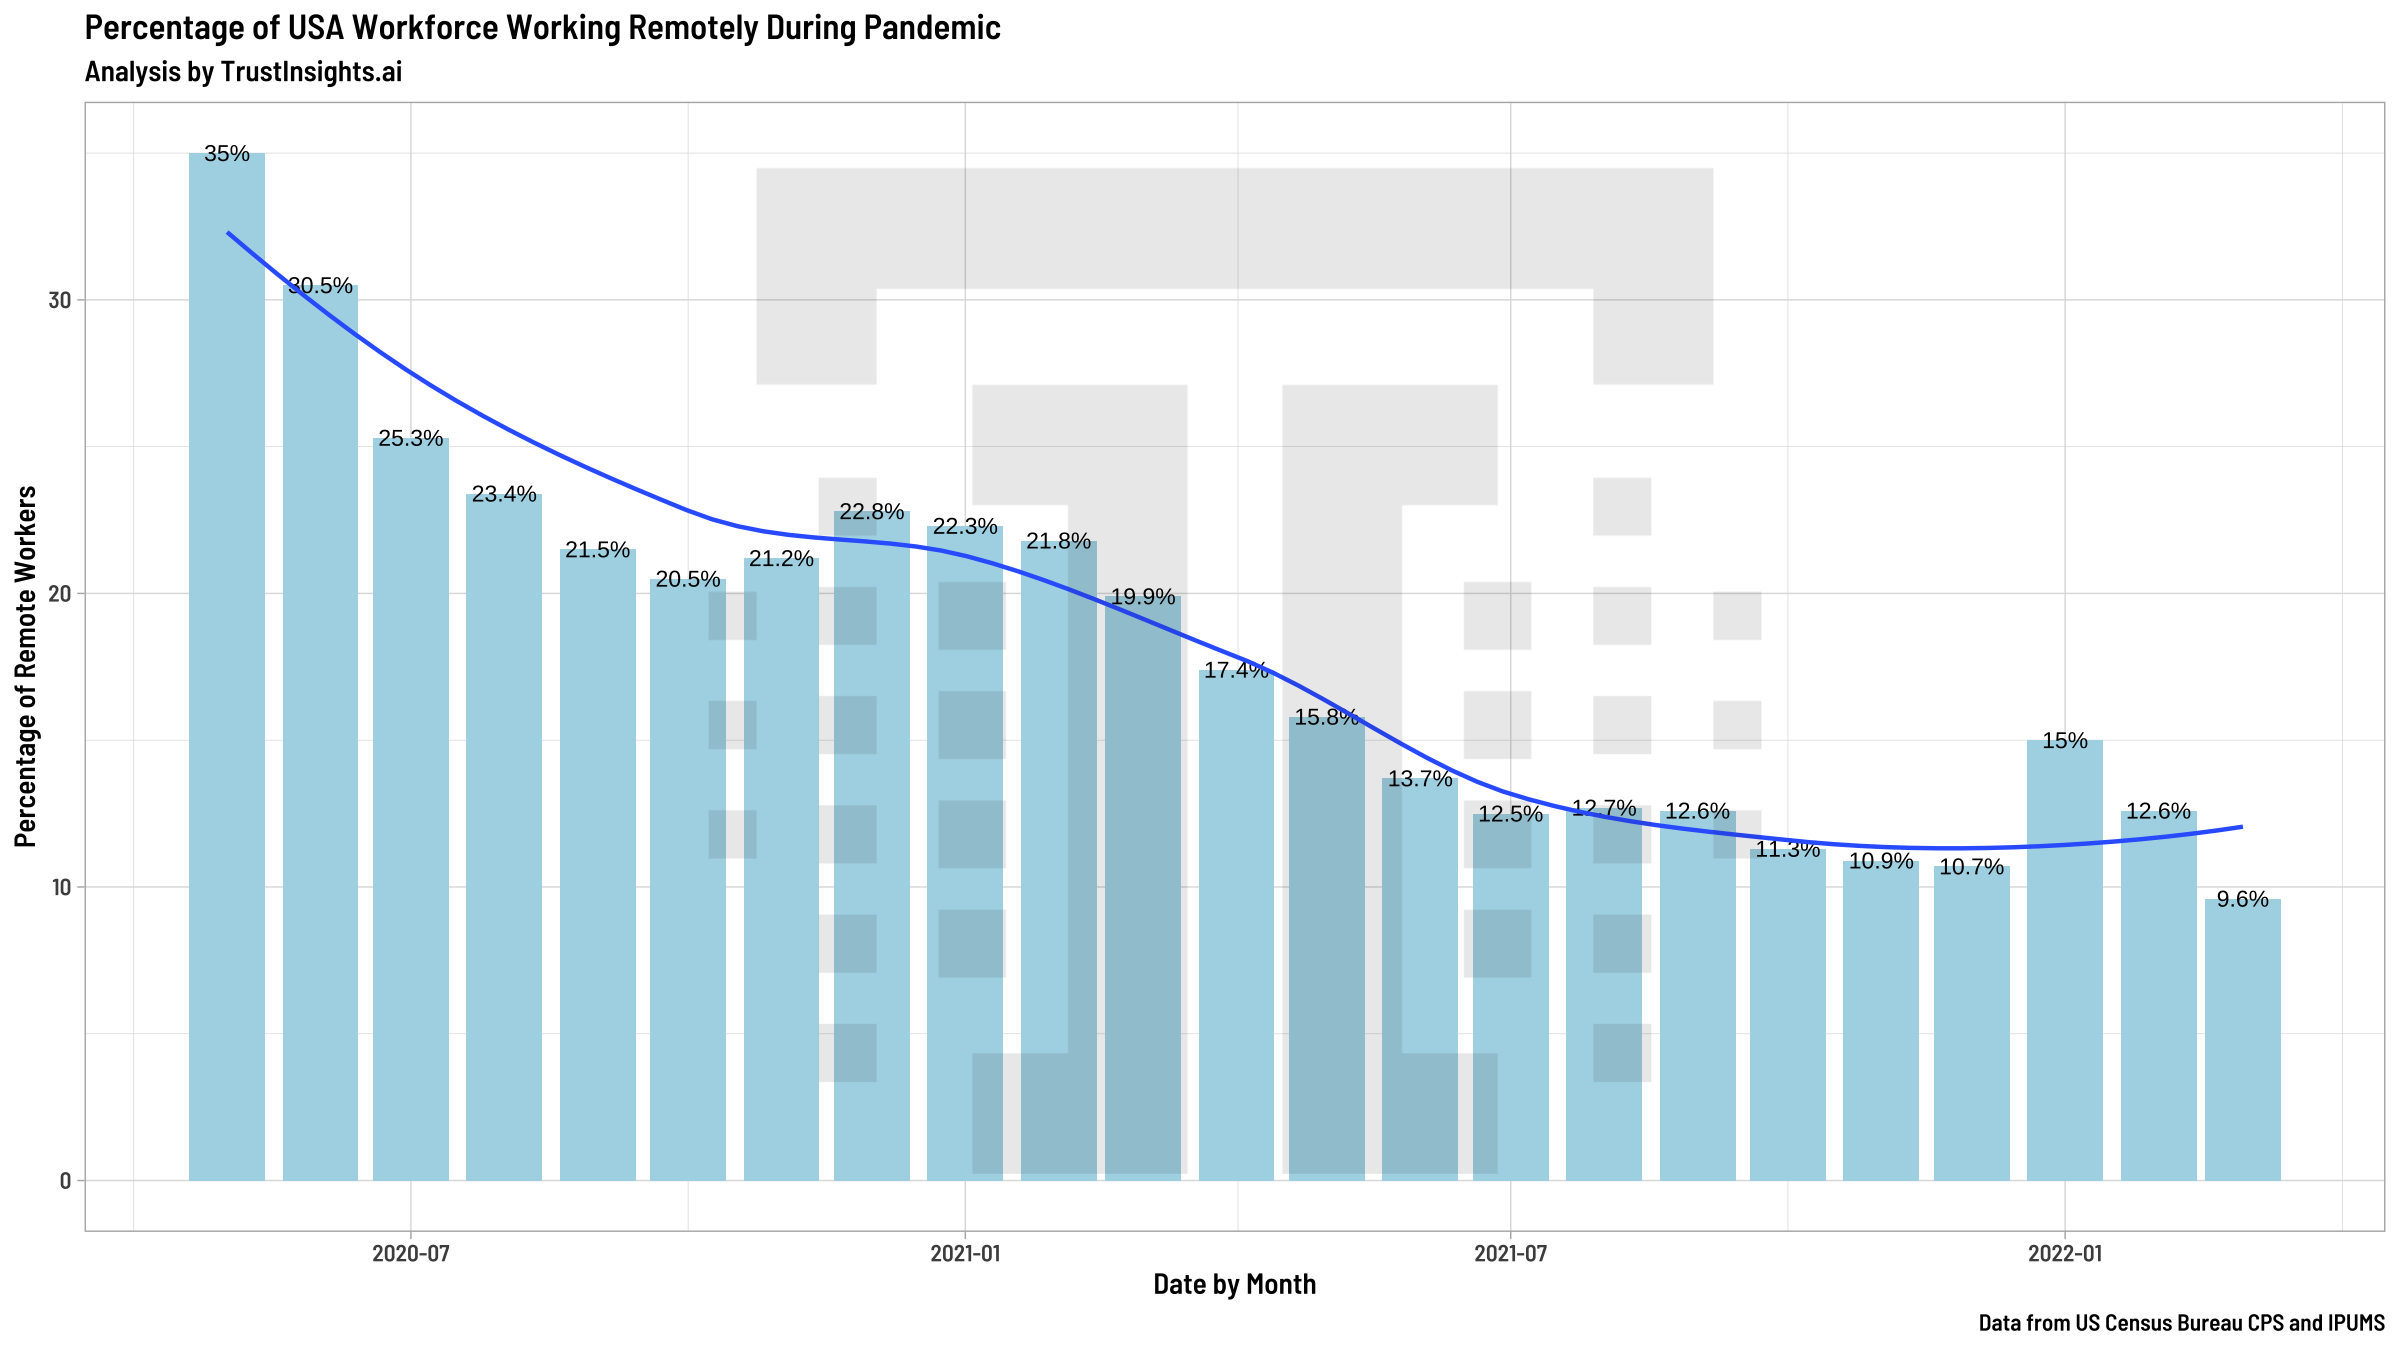
So what? What does that mean for us? Many, many times over the past two years, pundits have opined on the “new normal” or “next normal”; if we add a trend line to the data, we see a clear trend:

It’s fairly safe to opine that the trend since October 2021 really is the “new normal”. What we conclude from that is the current environment is “normal” – whatever operating conditions and trends you see in your data is more or less how things are and seem to be staying. That means you shouldn’t expect massive swings in your own data as often, and not driven by the pandemic directly. (though there are certainly plenty of other world issues that will cause anomalies in your data, from war to supply chain issues)
The other key takeaway from this data is that information you need to make decisions is readily and in many cases freely available from major governments if you’ve got the time to find it and make use of it. So often we find ourselves asking “Where could I get data about…” and forgetting that our tax dollars have already paid for the information to be collected, collated, vetted, and presented in some format that’s accessible to the public.
|
Need help with your marketing AI and analytics? |
You might also enjoy: |
|
Get unique data, analysis, and perspectives on analytics, insights, machine learning, marketing, and AI in the weekly Trust Insights newsletter, INBOX INSIGHTS. Subscribe now for free; new issues every Wednesday! |
Want to learn more about data, analytics, and insights? Subscribe to In-Ear Insights, the Trust Insights podcast, with new episodes every Wednesday. |


