This data was originally featured in the September 1, 2021newsletter found here: https://www.trustinsights.ai/blog/2021/09/inbox-insights-september-1-2021-were-hiring-post-mortems-linkedin-algorithm/
In this week’s Data Diaries, you voted for Kickstarter data in our Analytics for Marketers Slack group, so let’s see what we were able to find.
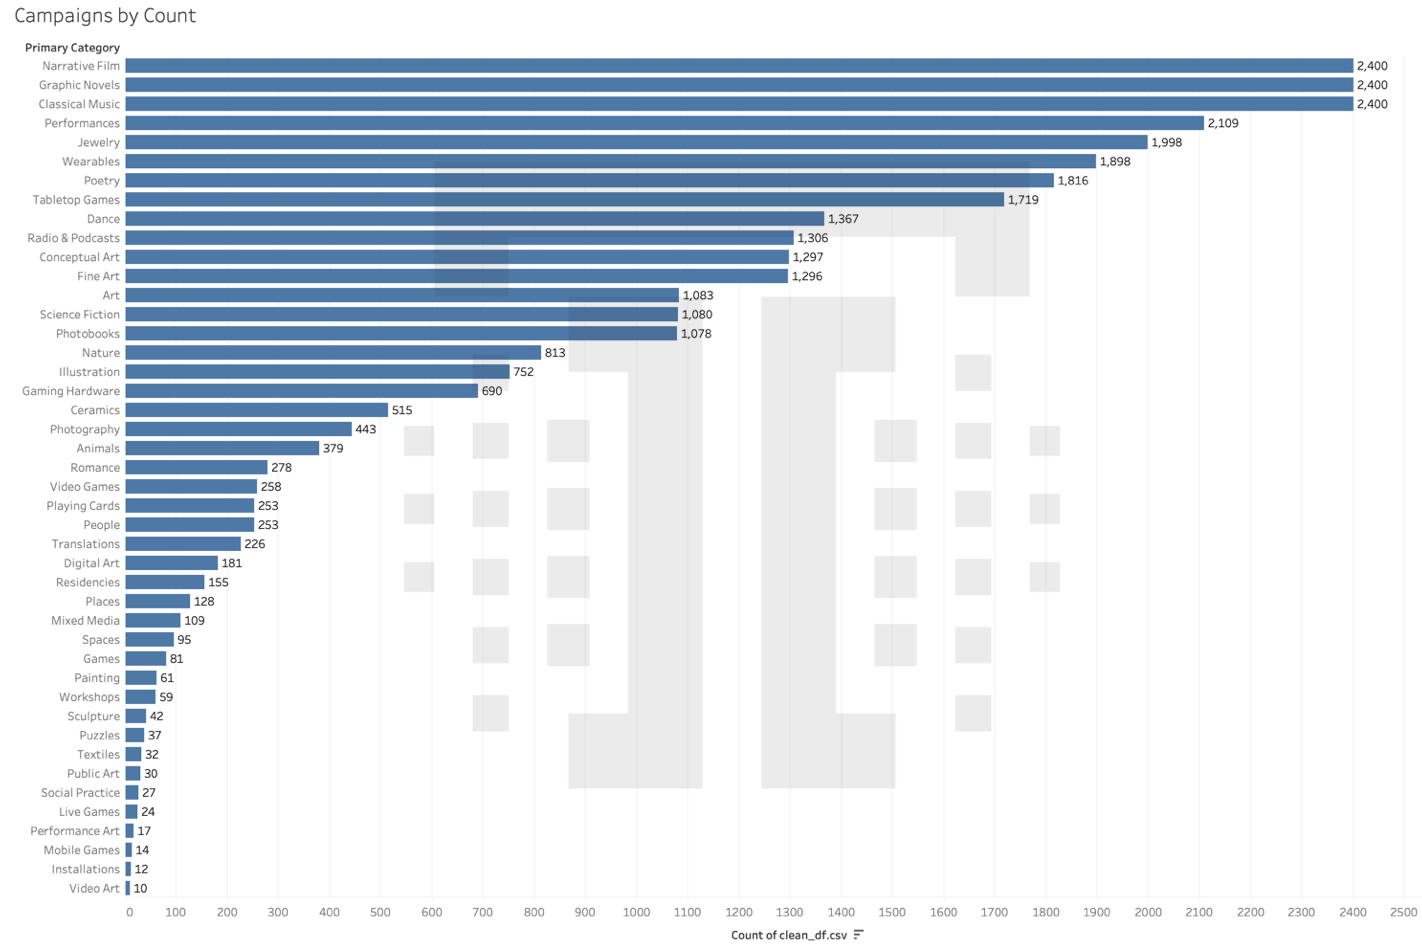
In an sample of ~31,000 Kickstarter campaigns in July 2021, we wanted to understand funded vs. non-funded campaigns (meaning that the pledged amount matched or exceeded the goal amount) and what factors, if any, seemed to hint at whether a campaign would be funded or not. First, let’s look at the landscape.
The top 3 categories for total number of campaigns are Narrative Films, Graphic Novels, and Classical Music.
Which campaigns attract the most generous pledges?
The top 3 categories for most generous median pledges are performance art ($107.29 per backer), spaces ($103.68 per backer), and wearables ($100.46 per backer).
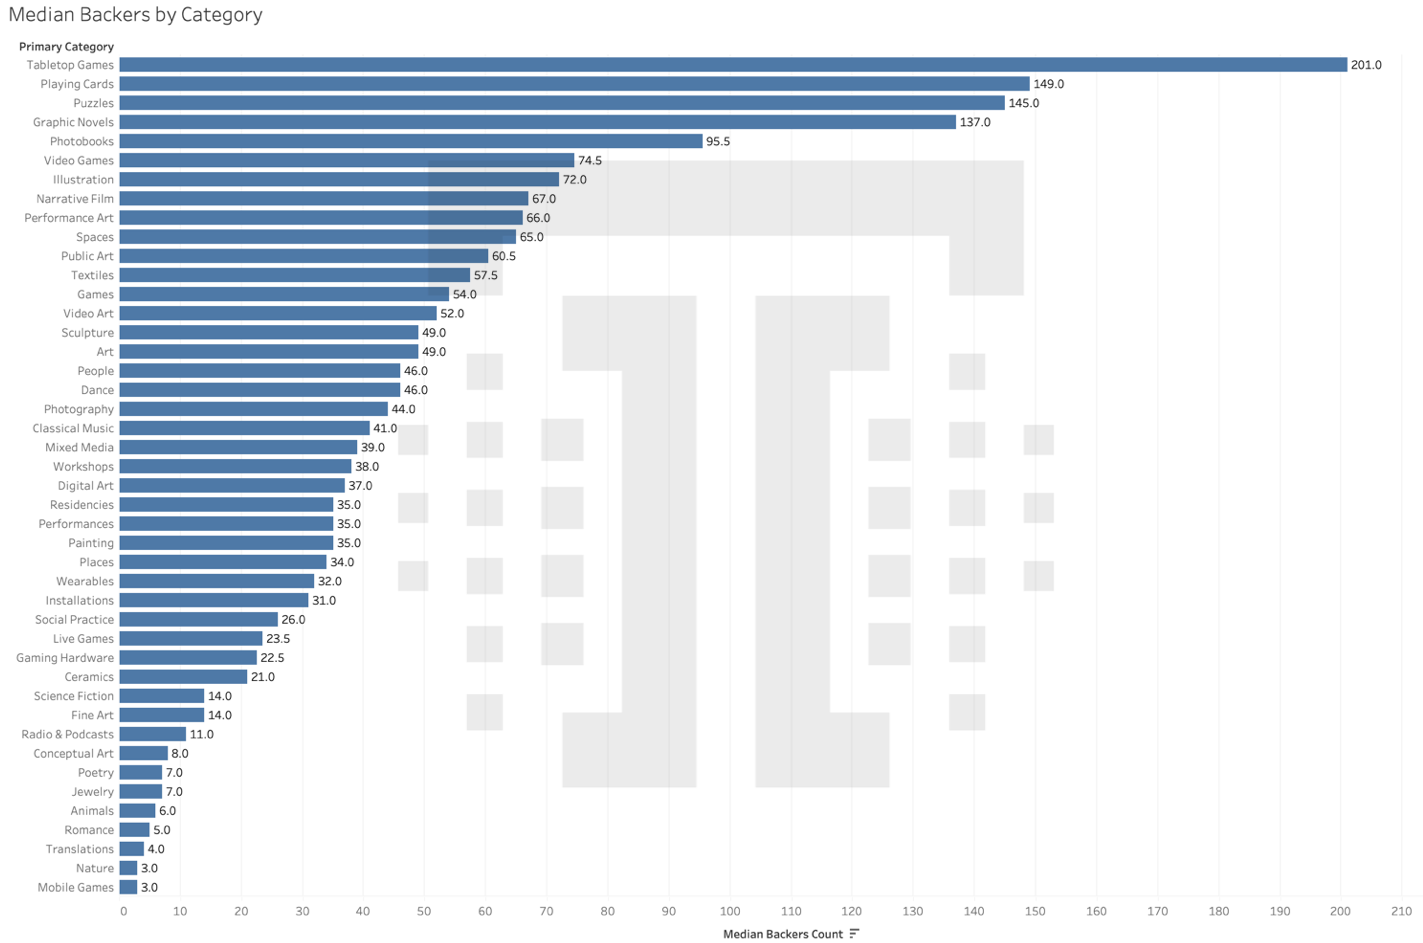
Which campaigns accrue the most backers?
The top 3 categories for largest median number of backers per campaign are tabletop games (201 backers per campaign), playing cards (149 backers per campaign), and puzzles (145 backers per campaign).
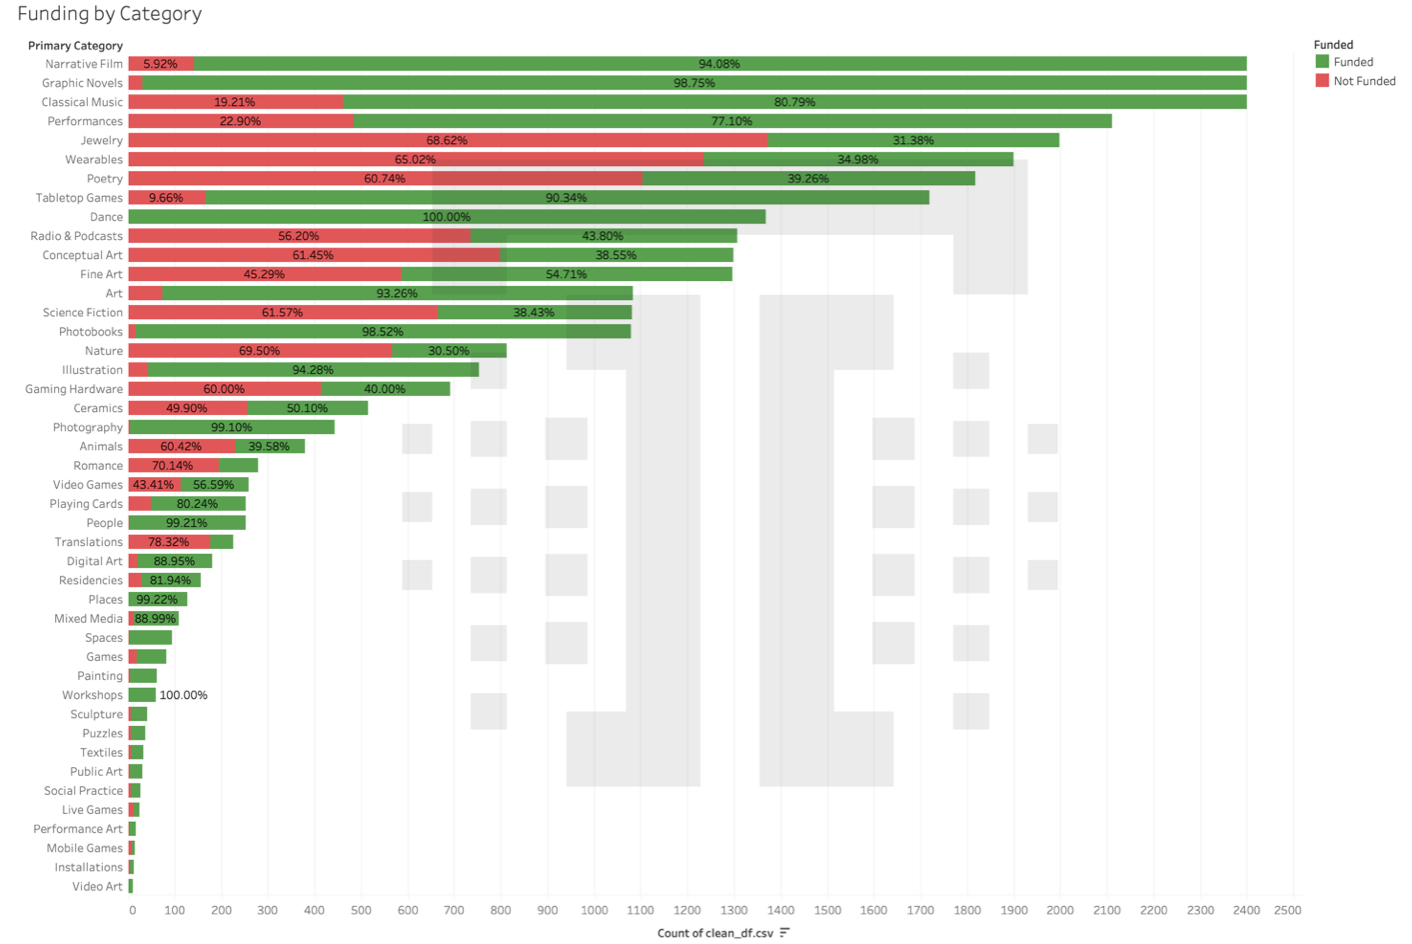
Now, onto funding. What campaigns successfully close the most?
For campaigns with substantial volume, Dance campaigns closed at a 100% rate in July 2021, followed by Graphic Novels at 98.75%, and Photobooks at 98.52%.
The big categories that did less well were jewelry, wearables, and poetry.
Key takeaways: Kickstarters are all about networks. The better you market your kickstarter, the more backers you’ll receive. The better you set rewards, the higher pledges you’ll receive. What we see in this examination is that entertainment-focused campaigns seem to perform the best – but in any category, there are a lot of campaigns competing for attention and dollars.
We’ve got even more data to share, but it’s too much for this newsletter, so we’ll post the remaining data in Analytics for Marketers.
Methodology: Trust Insights extracted 31,221 unique Kickstarter campaigns from WebRobots.io for July 2021, with duplicates filtered out. The timeframe of the data is July 1-31, 2021. The date of study is August 31, 2021. Trust Insights is the sole sponsor of the study and neither gave nor received compensation for data used, beyond applicable service fees to software vendors, and declares no competing interests.
|
Need help with your marketing AI and analytics? |
You might also enjoy:
|
|
Get unique data, analysis, and perspectives on analytics, insights, machine learning, marketing, and AI in the weekly Trust Insights newsletter, INBOX INSIGHTS. Subscribe now for free; new issues every Wednesday! |
Want to learn more about data, analytics, and insights? Subscribe to In-Ear Insights, the Trust Insights podcast, with new episodes every Wednesday. |

 click for a full size image
 click for a full size image
 click for a full size image
 click for a full size image


