This data was originally featured in the March 24, 2021 newsletter found here: https://www.trustinsights.ai/blog/2021/03/in-the-headlights-march-24-2021-spring-cleaning-3-year-anniversary-content-republishing/
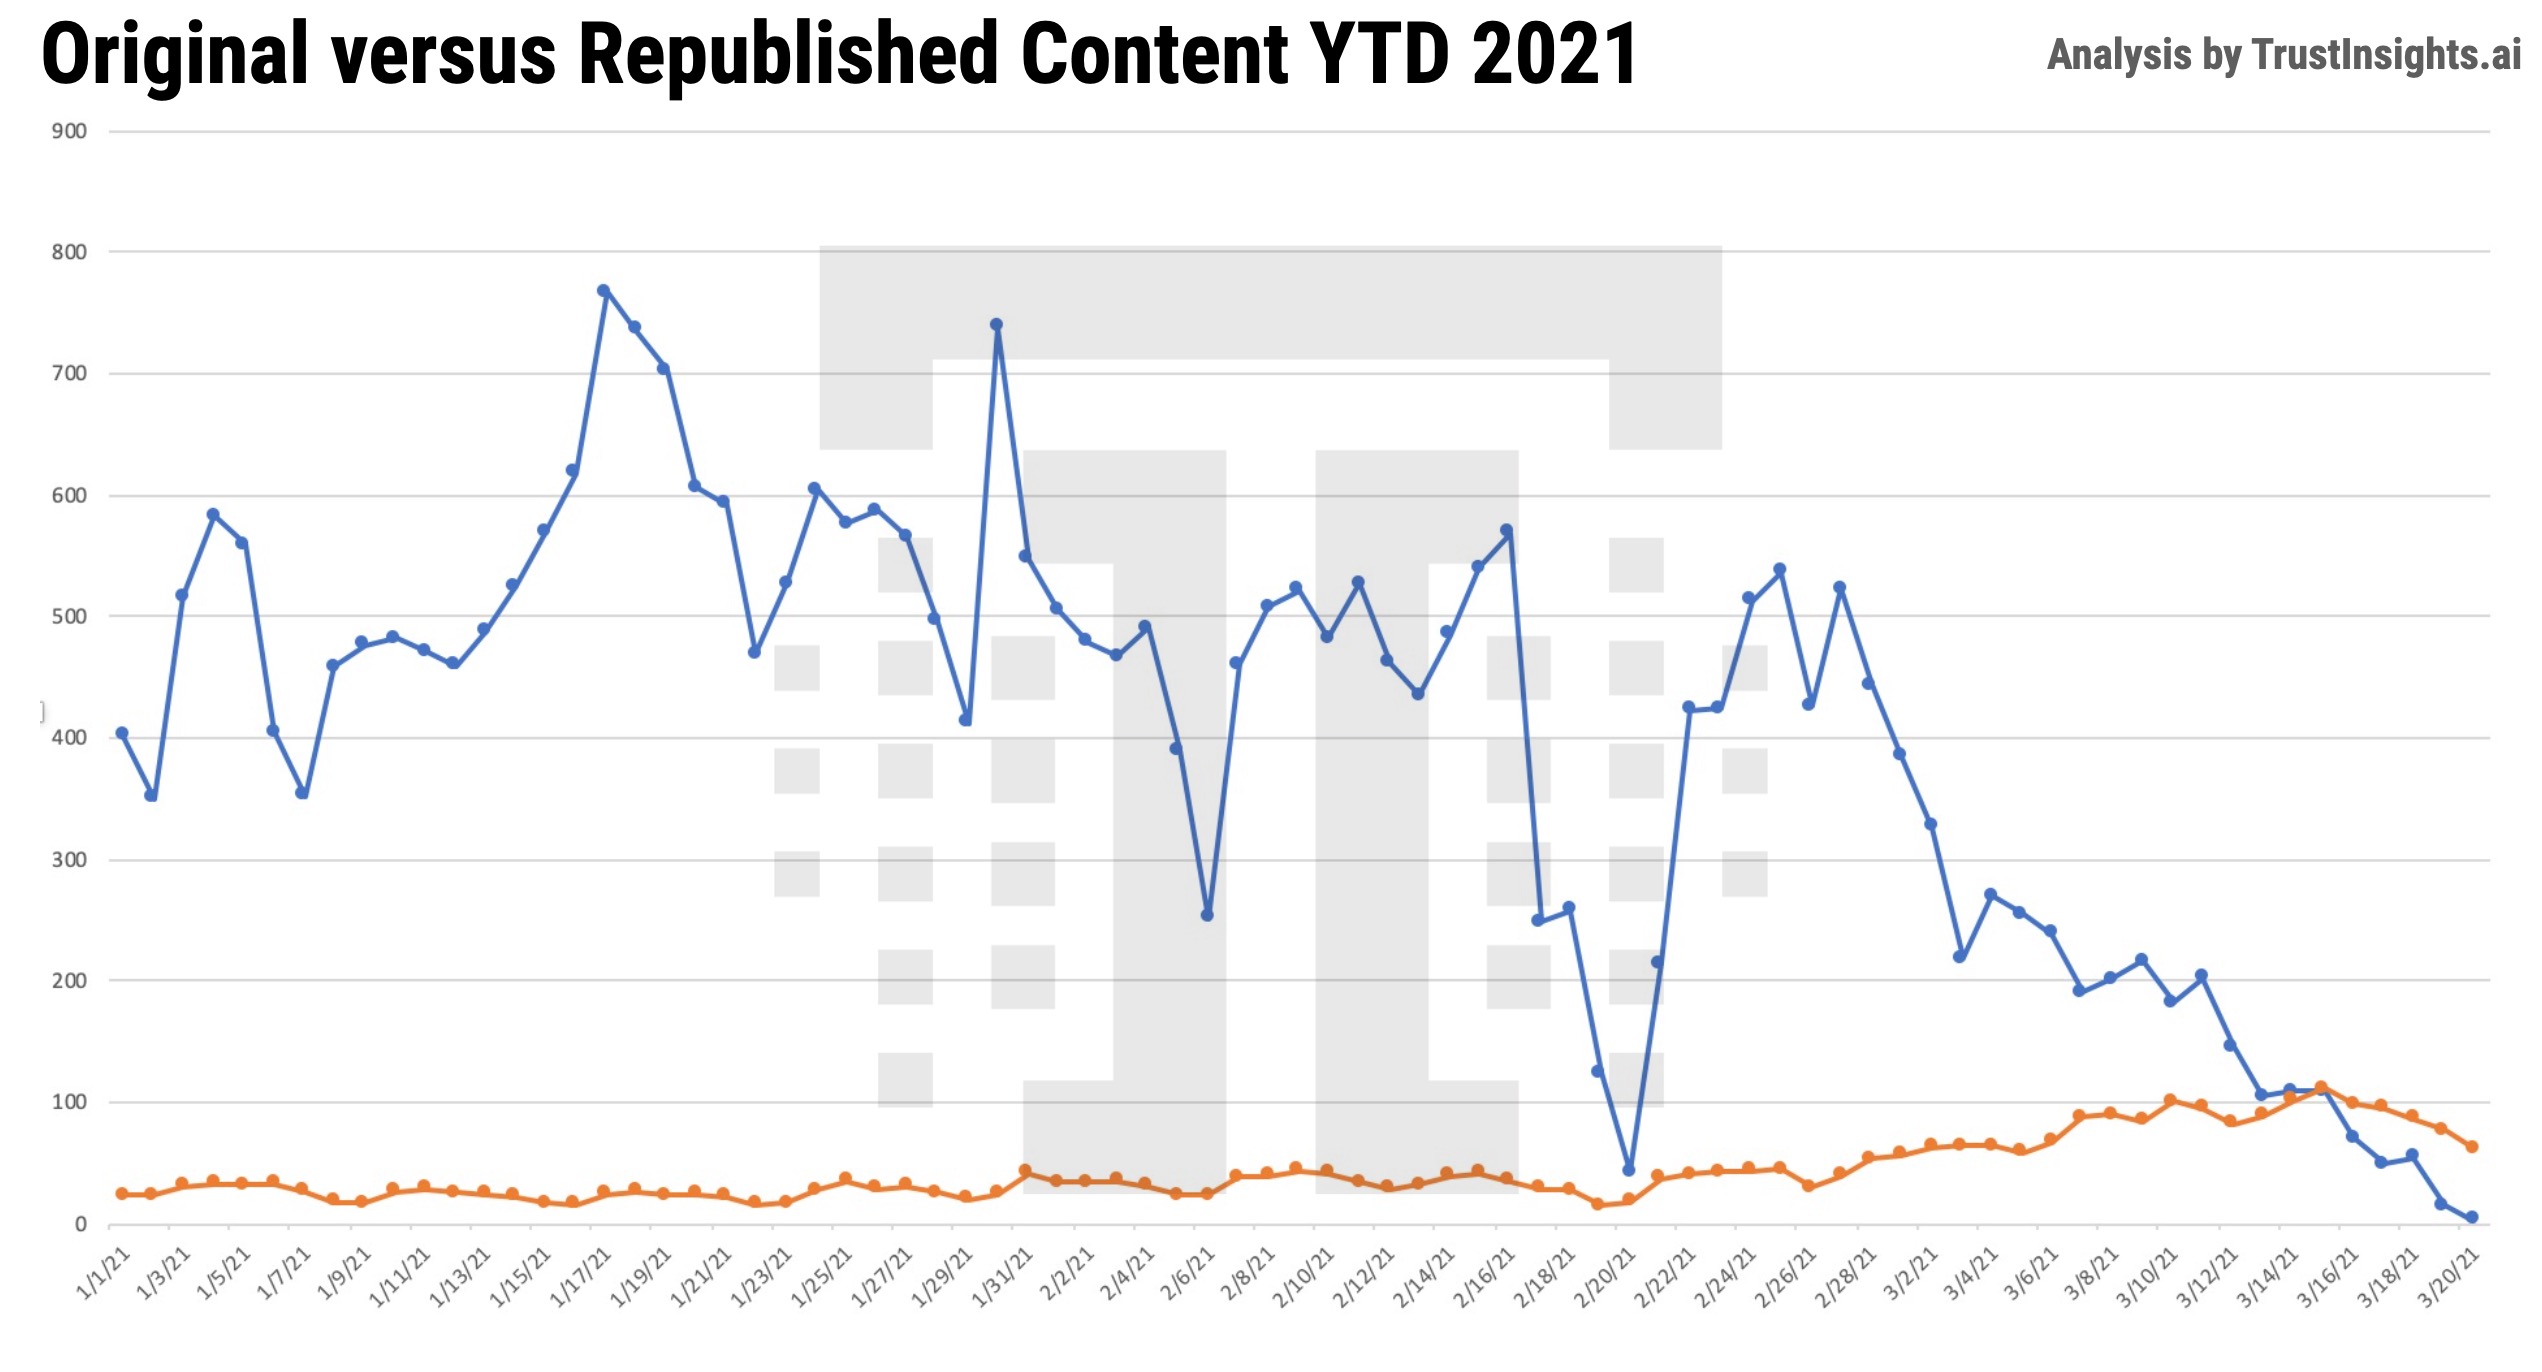
In this week’s Rear View Mirror, we dig into the latest metrics on content republishing. How much content are we republishing, and does republishing work? In past issues, we’ve examined the art of republishing content and previously concluded that it does generate results, but not as well as original content. Let’s see what 2021 holds thus far. First, the overall content publishing trends:

What we see here is a fairly consistent amount of content republising until about the end of February, after which original content – content never published previously – drops off dramatically, from a high in February of almost 600,000 pieces of content in a day to less than 50,000 pieces of content a day in mid-March. Meanwhile, republished content rises from around 50,000 pieces a day to over 100,000 pieces of content a day in mid-March.
Why is this the case? We don’t know; there doesn’t appear to be an obvious explanation for the overall dramatic decline in content.
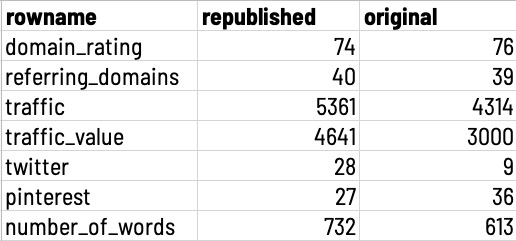
When we look at the content performance for the top 5,000 articles per week over the same time period, we see some interesting performance:

What we see is republished content outperforms its original content peers, in some cases by considerable amounts. The average republished piece of content earns 1,000 more visits within the same time period as new content, and has larger numbers of shares in the same time period.
So, what’s the key takeaway here? Two things.
First, the unusual deficit of original content could be an opportunity; check using your SEO tool of choice to determine if your industry/niche is experiencing an original content lull, and if so, fill it while you can.
Second, republishing content is now delivering stronger results, so don’t be afraid to improve and republish content over time to supplement your original content.
Methodology: Trust Insights used AHREFS data about content with the most individual page traffic, published in the English language, for the query terms “a OR and OR the”, excluding homepages and explicit results. The timeframe of the data is January 1, 2021 – March 20, 2021. The date of study is March 22, 2021. Trust Insights is the sole sponsor of the study and neither gave nor received compensation for data used, beyond applicable service fees to software vendors, and declares no competing interests.
|
Need help with your marketing AI and analytics? |
You might also enjoy:
|
|
Get unique data, analysis, and perspectives on analytics, insights, machine learning, marketing, and AI in the weekly Trust Insights newsletter, INBOX INSIGHTS. Subscribe now for free; new issues every Wednesday! |
Want to learn more about data, analytics, and insights? Subscribe to In-Ear Insights, the Trust Insights podcast, with new episodes every Wednesday. |


